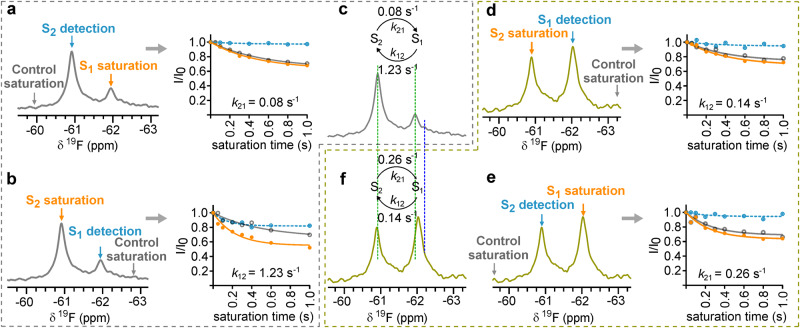
Fig. 1. 19F NMR of Y11tfmF-NT8-13 shows slow-exchanging conformational heterogeneity in complex with enNTS1 and enNTS1-R213.
19F STD experiments on a, b the complex of Y11tfmF-NT8-13 and enNTS1 and d, e Y11tfmF-NT8-13 and enNTS1-R213. In each experiment the intensity of the detected peak was measured by on-resonance irradiation (orange line, solid symbols) and equidistant off-resonance irradiation (grey line, open symbols) from the detected peak as control. The on- and off-resonance spectra were subtracted to obtain the saturation transfer exchange plots (dashed light blue line, filled symbols). In (c, f), the exchange rates extracted from the saturation plots are summarized above the spectra of Y11tfmF-NT8-13 in complex with enNTS1 (grey) (c) and enNTS1-R213 (olive) (f). The chemical shift of S1 and S2 are highlighted with green dotted lines. The dark blue line designates the chemical shift of free peptide. In all experiments, a train of 50 ms gaussian shaped pulses with a field-strength of 50 Hz was used for on and off-resonance saturation. Source data for this figure are provided as a Source data file.

