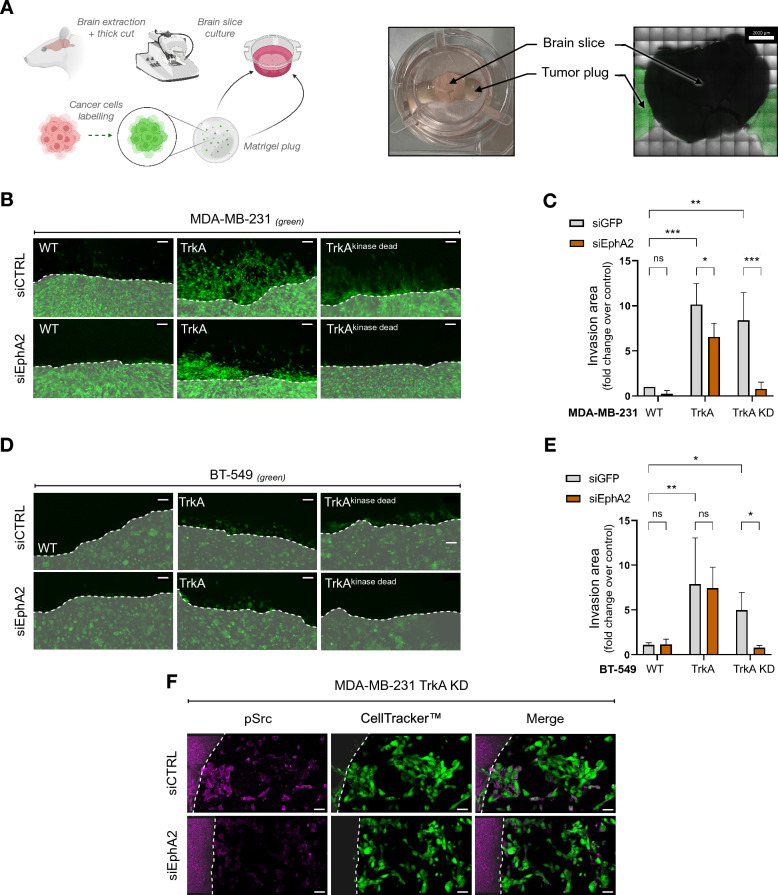
Fig. 4.
TrkA/EphA2 increases brain parenchyma invasion of TNBC. A Experimental approaches of ex vivo brain slices culture with TNBC. After dissection, the mouse brain is thickly sliced and cultured with the TNBC on an air/liquid interface over 72 h. B-E Representative pictures (B – D) and associated quantification C & E from the monitoring of CellTracker™ stained MDA-MB-231 WT/TrkA/TrkA KD or CellTracker™ stained BT-549 WT/TrkA/TrkA KD (green) during mouse brain slices invasion. F Overlay about Src activation (pink) in CellTracker™ stained MDA-MB-231-TrkA-KD (green) with or without prior siEphA2 transfection. Data in B-E are representative of 3 independents experiments with all condition realized in duplicate. Data in F were performed in duplicate for each condition. Data in C and E are presented as a column bar graph with SD. Two-way ANOVA followed by Tukey’s test for C and E. *P ≤ 0.05, **P ≤ 0.01, ns (non-significant). For B, D and F, the Matrigel® plug is highlighted by a whitish area delimited with dotted lines. For B and D scale bar = 100 µm, and F, scale bar = 30 µm

