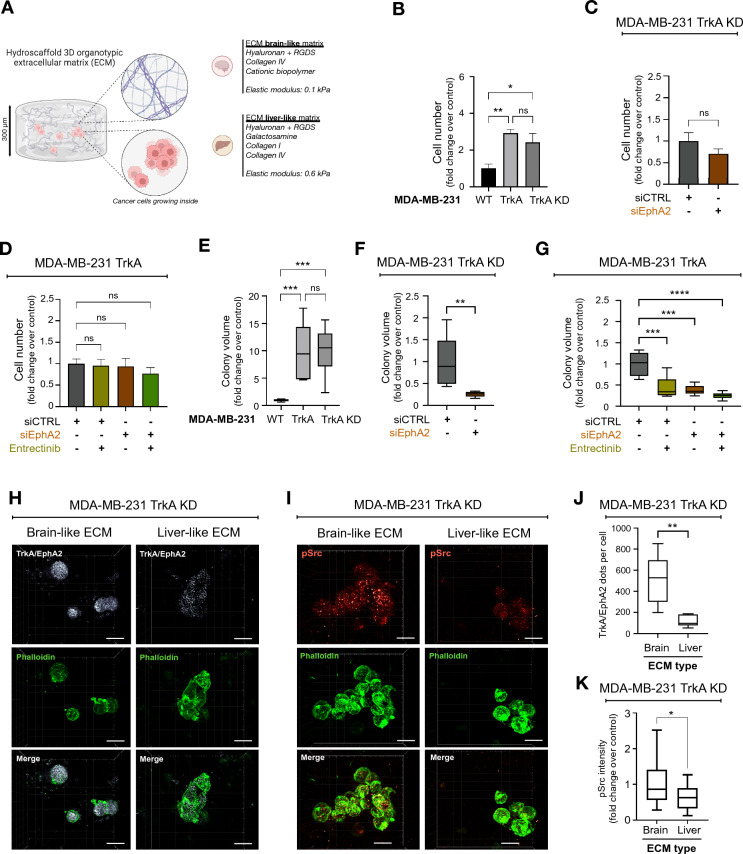
Fig. 5.
TrkA/EphA2 increases TNBC persistence in brain-like ECM. A Schematic representation of in vitro brain-like and liver-like 3D ECM (from BIOMIMESYS®) where MDA-MB-231 cells are maintained. B-G According to the TrkA overexpression status in MDA-MB-231, cell number (B & C) and colonies volumes (E–G) are quantified after entrectinib and/or EphA2 targeting siRNA of 21 days culture in 3D organotypic ECM. (I and K) Representative pictures (H) and associated quantification (J) of TrkA/EphA2 PLA signal inside MDA-MB-231-TrkA-KD incubated in brain-like or liver-like ECM. I and K Representative confocal images (J) and associated quantification (L) of phosphorylated Src (active form) signal in MDA-MB-231-TrkA-KD incubated in brain-like or liver-like ECM. Data in B-G are representative of 2 independents experiments performed in triplicate. These data H to K are from one replicate experiment performed on approximately 30 cells for each condition C. Unpaired 2-tailed t test for B, C, E, F, J and K. Two-way ANOVA followed by Tukey’s test for D and G. *P ≤ 0.05, **P ≤ 0.01, ***P ≤ 0.001, ****P ≤ 0.0001, ns (non-significant). For H and J scale bar = 20 µm

