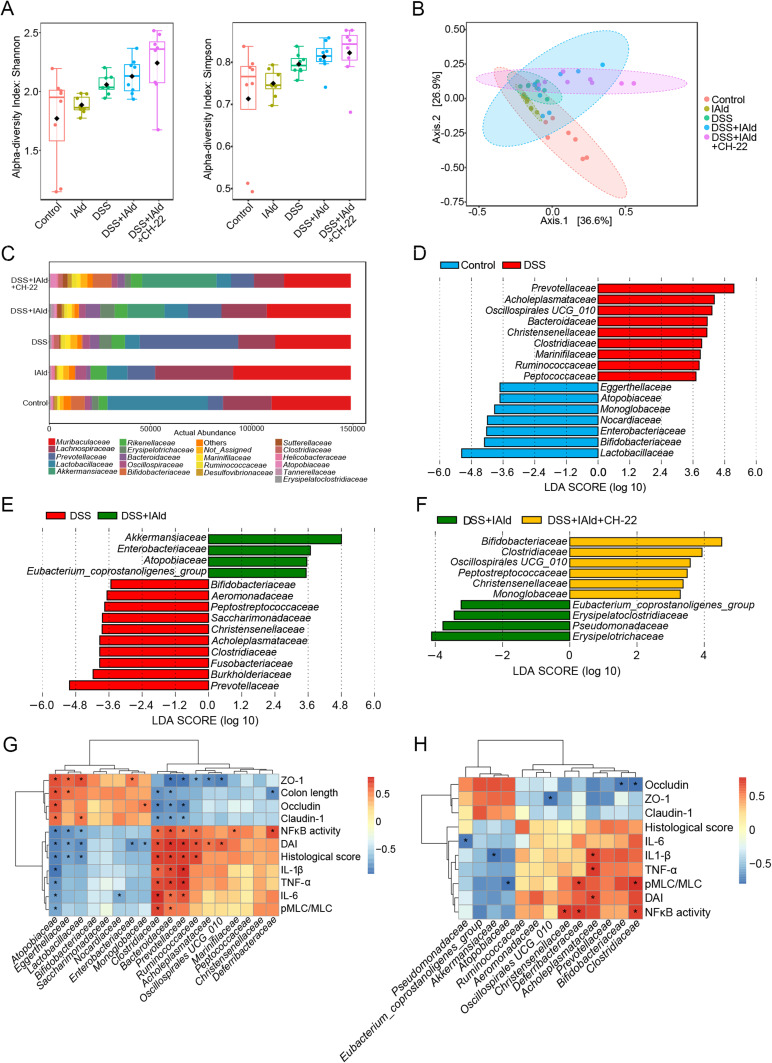
Figure 9.
Effects of IAld and AhR activation on the gut microbiome composition in a DSS-induced mouse model.
Notes: (A) α-diversity was determined using Simpson index and Shannon index. (B) β-diversity was determined using weighted UniFrac distance-based Principal Coordinates Analysis (PCoA) (R2 = 0.49613 P = 0.001). (C) The relative abundance of bacteria of different groups at family level. (D-F) LDA scores from LefSe analysis were performed on relative ASV between groups of Control vs DSS; DSS vs DSS+IAld; DSS+IAld vs DSS+IAld+CH-22. (G and H) Correlation heatmap was calculated by using Spearman correlation coefficient. The data are shown as the mean ± SEM (n = 5–8/group). *p < 0.05.

