Figure 3.
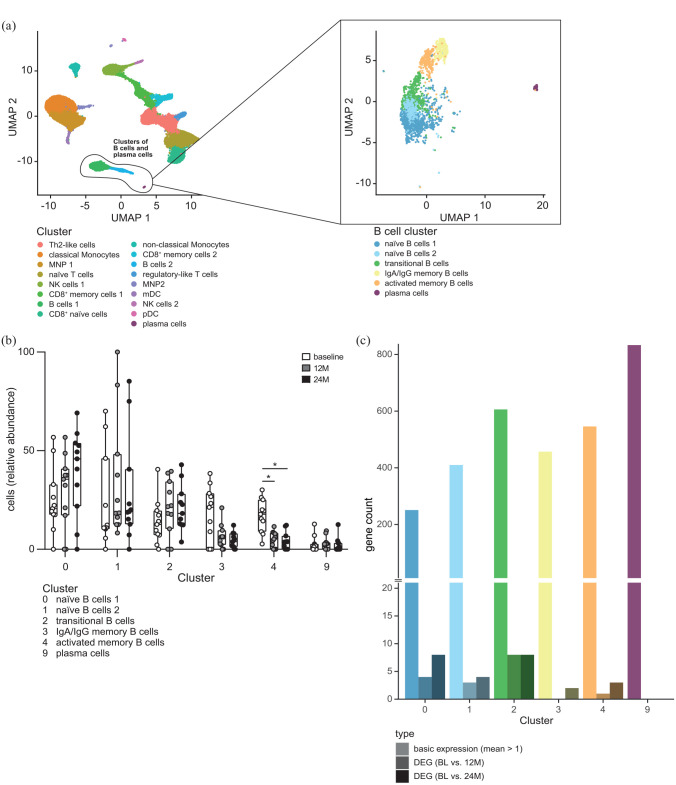
Single-cell transcriptomic analysis from frozen PBMC of RRMS patients (n = 11) at BL, after 12 (12M), and 24 months (24M) of cladribine therapy initiation. (a) UMAP plot representing all cell cluster (left) identified (all time points: BL, 12M, 24M). UMAP plot (right) represents a subset analysis of B cell and plasma cell clusters (highlighted and based on left UMAP). Cluster names were assigned based on marker gene expressions [feature definition is depicted in Supplemental Figure 8(A) and (B)]. (b) Grouped box plots show relative abundance of distinct B cell and plasma cell clusters for BL, 12M, and 24M after cladribine therapy initiation. Cluster defined as in Supplemental Figure 8(B). (c) Total gene counts with chosen expression patterns per cluster. Depicted are the number of genes with a minimum average expression level found in each cluster (mean count > 1; shown in bright/on the left side), as well as the number of differentially expressed genes between the conditions BL and 12M (shaded/center) and between BL and 24M (dark/right) within each cluster (adjusted p-value < 0.05).
BL, baseline; PBMC, peripheral blood mononuclear cells; RRMS, relapsing-remitting multiple sclerosis; UMAP, uniform manifold approximation and projection.

