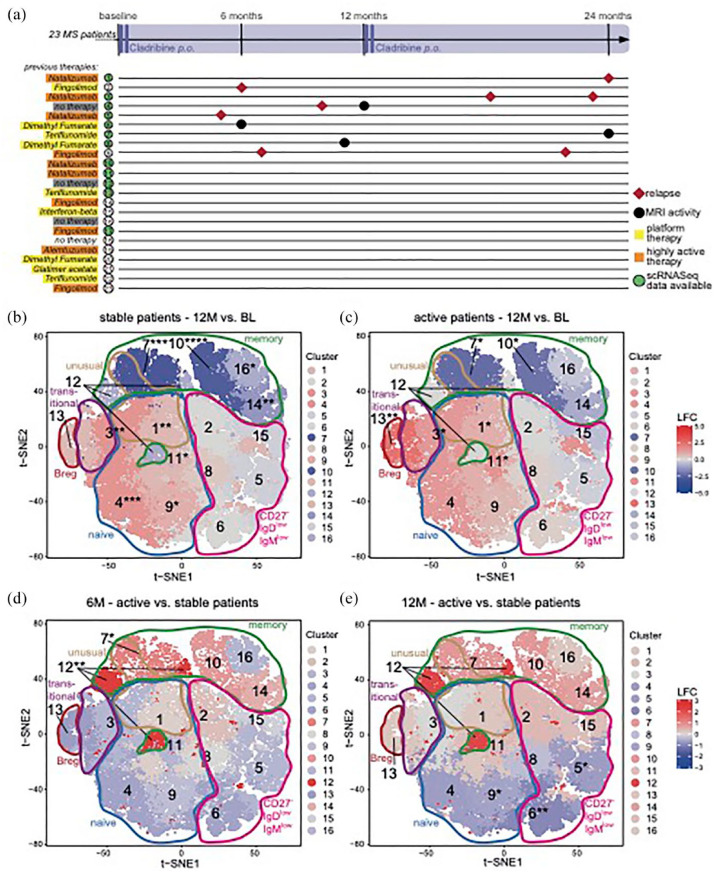
Figure 4.
Dynamics of B cell clusters as determined by flow cytometry of 23 cladribine treated RRMS patients at BL, 6 (6M) and 12 months (12M) in relation to treatment response. (a) Schematic visualization of relapses and MRI activity of all 23 patients investigated. Previous disease modifying therapies categorized as platform therapy (teriflunomide, glatiramer acetate, dimethyl fumarate, interferon beta formulation, yellow) and highly active therapy (fingolimod, natalizumab, alemtuzumab, orange). Additional information is summarized in Supplemental Table 3. Grey = therapy naïve patients. Single-cell sequencing analysis available of patients with green marked numbers [Figure 3]. (b–e) t-SNE-based heatmaps with PhenoGraph clustering and encirclements as in Figure 1(d) of stable [(b) nBL + 12M = 13] and active [(c) nBL = 9, n12M = 8] patient cohorts, comparing the time points 12M to BL and of time points 6M [(d) nact = 5, nsta = 9] and 12M [(e) nact = 5, nsta = 16], comparing active to stable patient cohorts. The color of the cluster signifies the LFC of cluster abundance in up- (red) or downregulation (blue) 12M as compared to BL (b and c) or active compared to stable (d and e). Statistical significance (b–e) of changes was assessed by Dunn’s test with false discovery rate-correction for multiple comparisons as depicted by asterisks next to cluster numbers and in the corresponding box plots.
BL, baseline; LFC, log2 fold change; MRI, magnetic resonance imaging; PBMC, peripheral blood mononuclear cells; RRMS, relapsing-remitting multiple sclerosis; t-SNE, t-distributed stochastic neighbor embedding.

