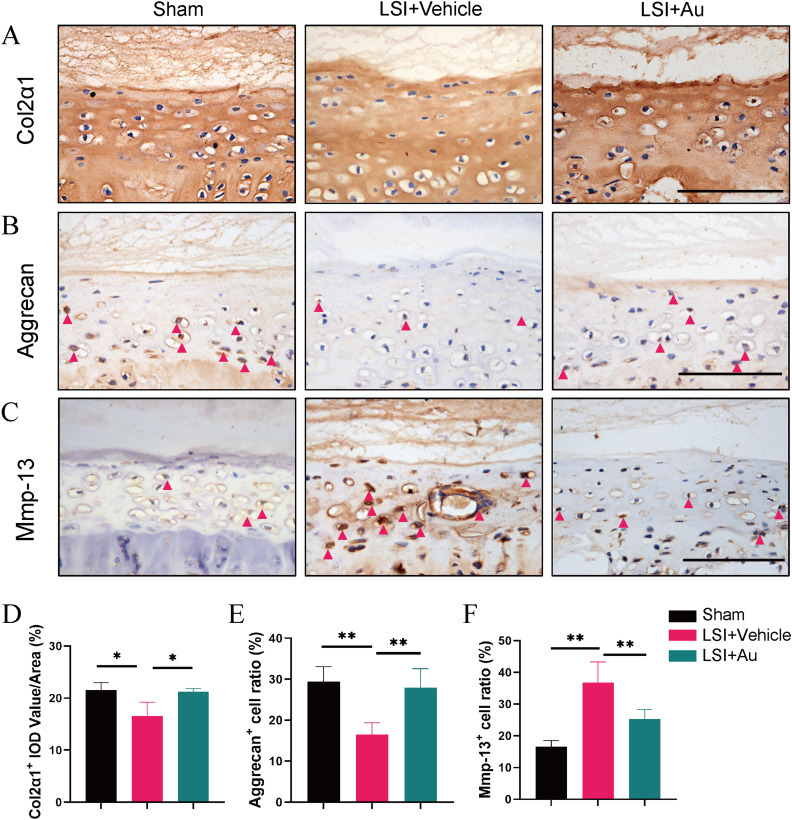
Figure 4.
The effect of CGA on LSI-induced anabolism and catabolism in cartilage endplate. (A) The representative images of immumohistochemical staining and quantifications of Col2α1 in the caudal L4-5 endplate at 4 weeks. (B) The representative immumohistochemical images for Aggrecan and the ratio of positive cells in the whole caudal L4-5 endplate at 4 weeks. Red arrows indicated positive cells. Scale bar = 100 μm. (C) Immunostaining images and quantificational evaluation of Mmp-13 expression in caudal L4-5 endplate at 4 weeks post operation. Red arrows indicated positive cells. Scale bar = 100 μm. (D–F) Quantitative analyses of the rate of positive cells and average IOD value. The dose of Au was 10 mg/kg/day. Data were presented as means ± S.D. *p < 0.05; **p < 0.01; n ≥ 3 in each group.

