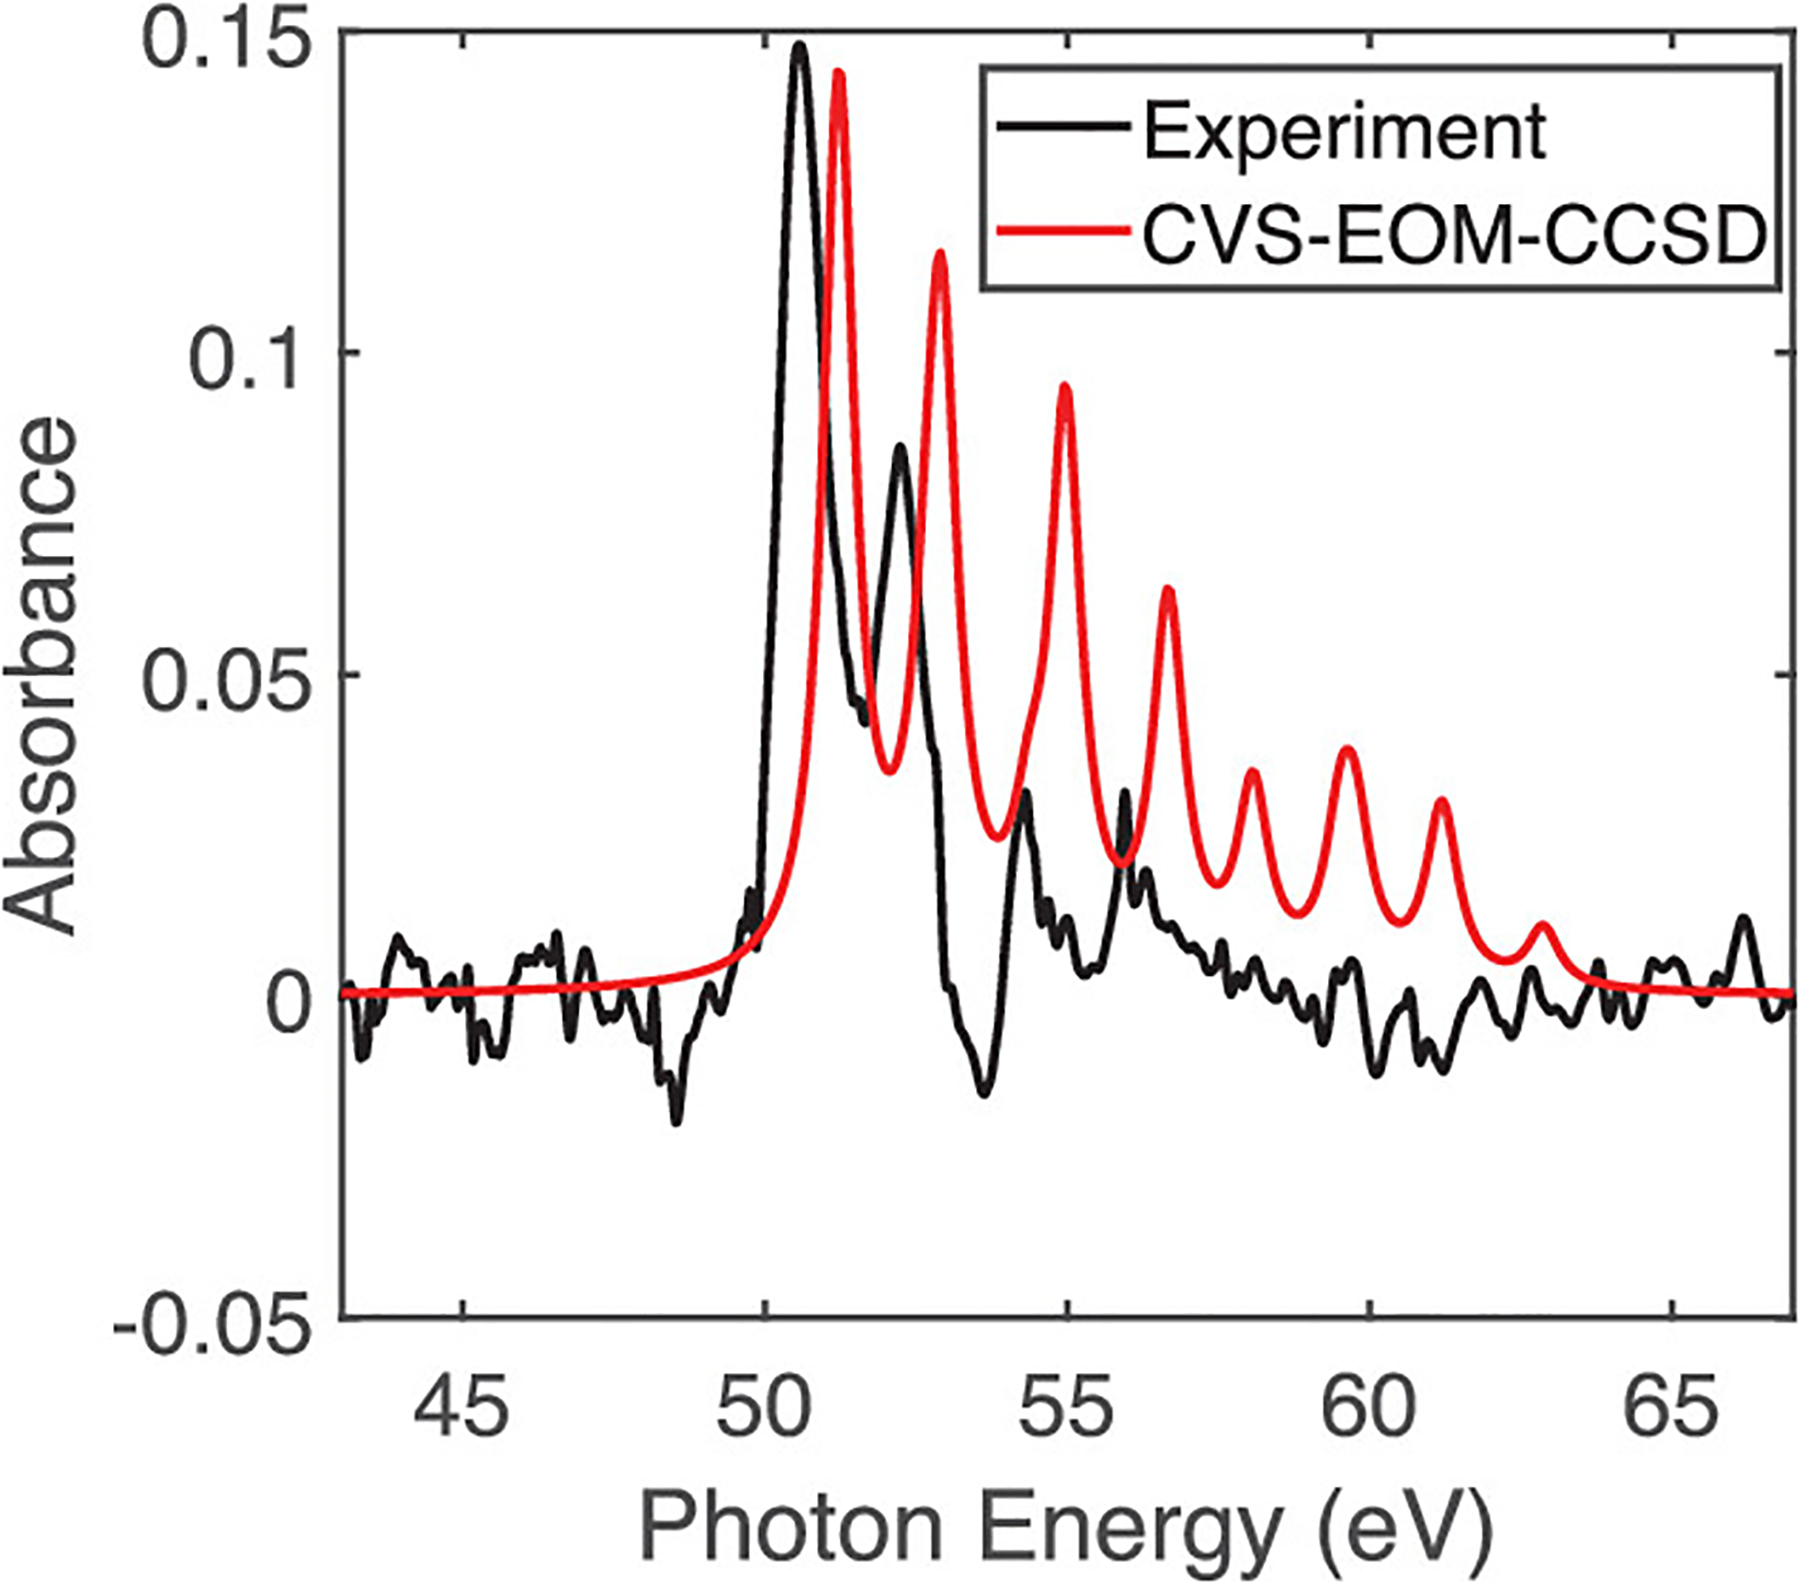
Figure 2.

XUV absorption spectrum near the iodine N4,5 edge of gas-phase AcI at 3 Torr static pressure. The y axis is the measured optical density, defined by OD = log10(I/I0), where I and I0 are the intensities of XUV through the interaction region with and without AcI. A broad, unstructured absorption, in excess of 0.45–0.65 OD, due to valence ionization, was subtracted from the experiment. The raw experimental spectrum is shown in Figure S2.
