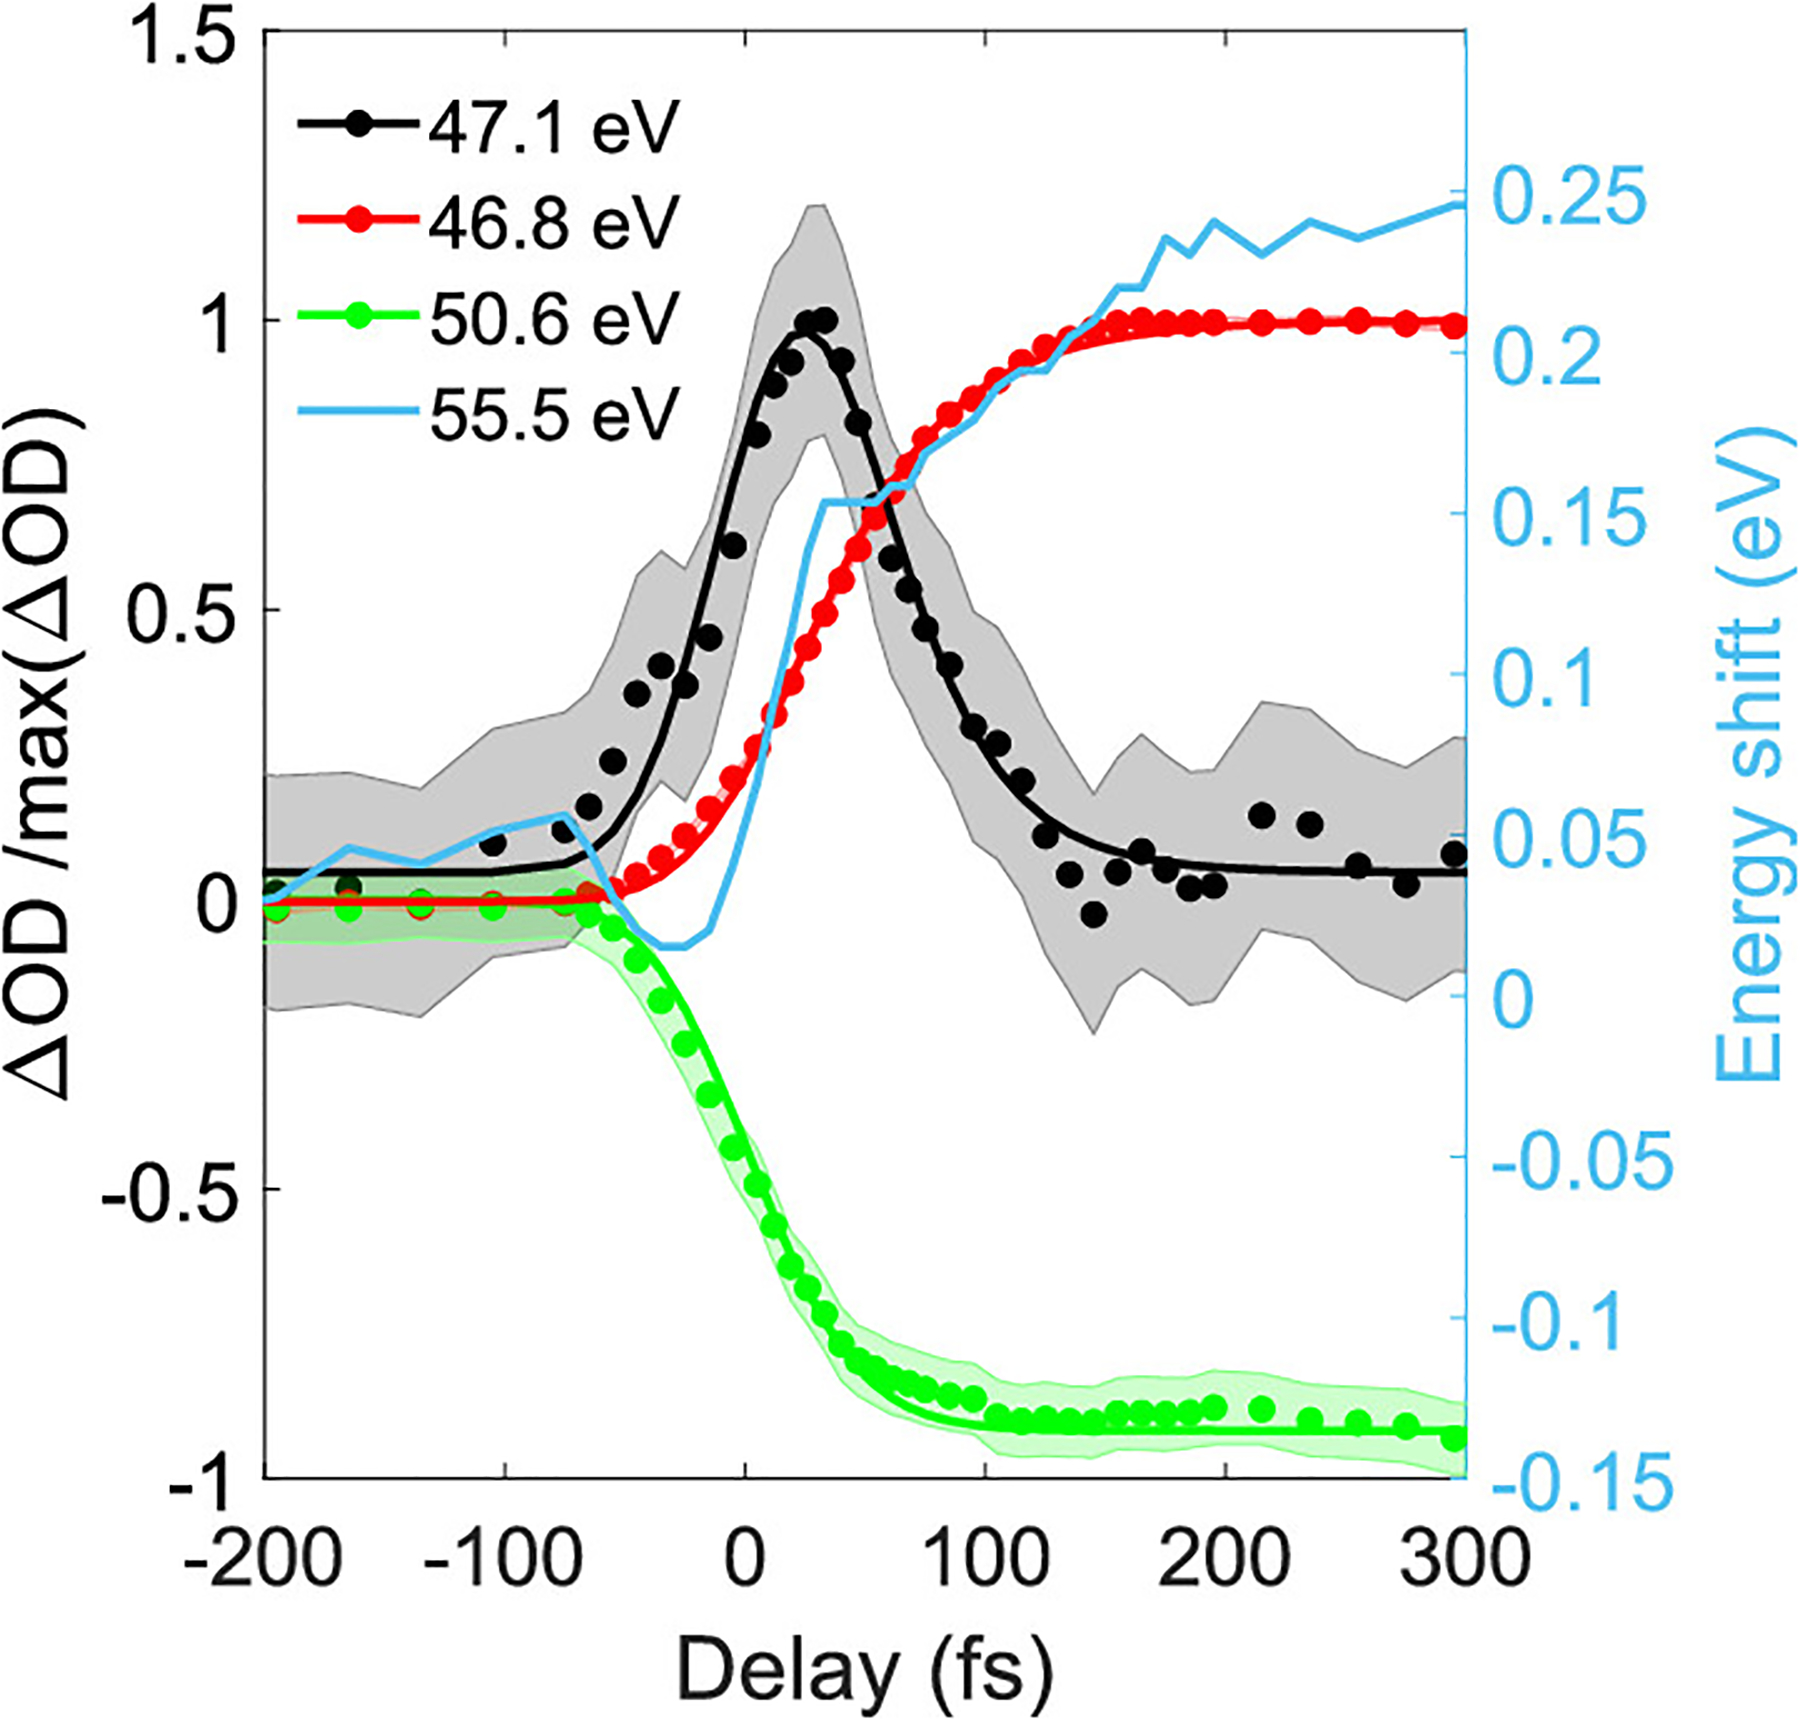
Figure 4.

Integrated differential absorbance of individual absorption features, divided by their maximum or minimum, shown as filled circles. Furthermore, a step function has been subtracted from the 47.1 eV outline, as indicated in the text. The shaded region corresponds to the ±1σ error bar. Fits to these time traces are shown in color-matched solid lines. The energy shift of the 55.5 eV feature is shown in light blue.
