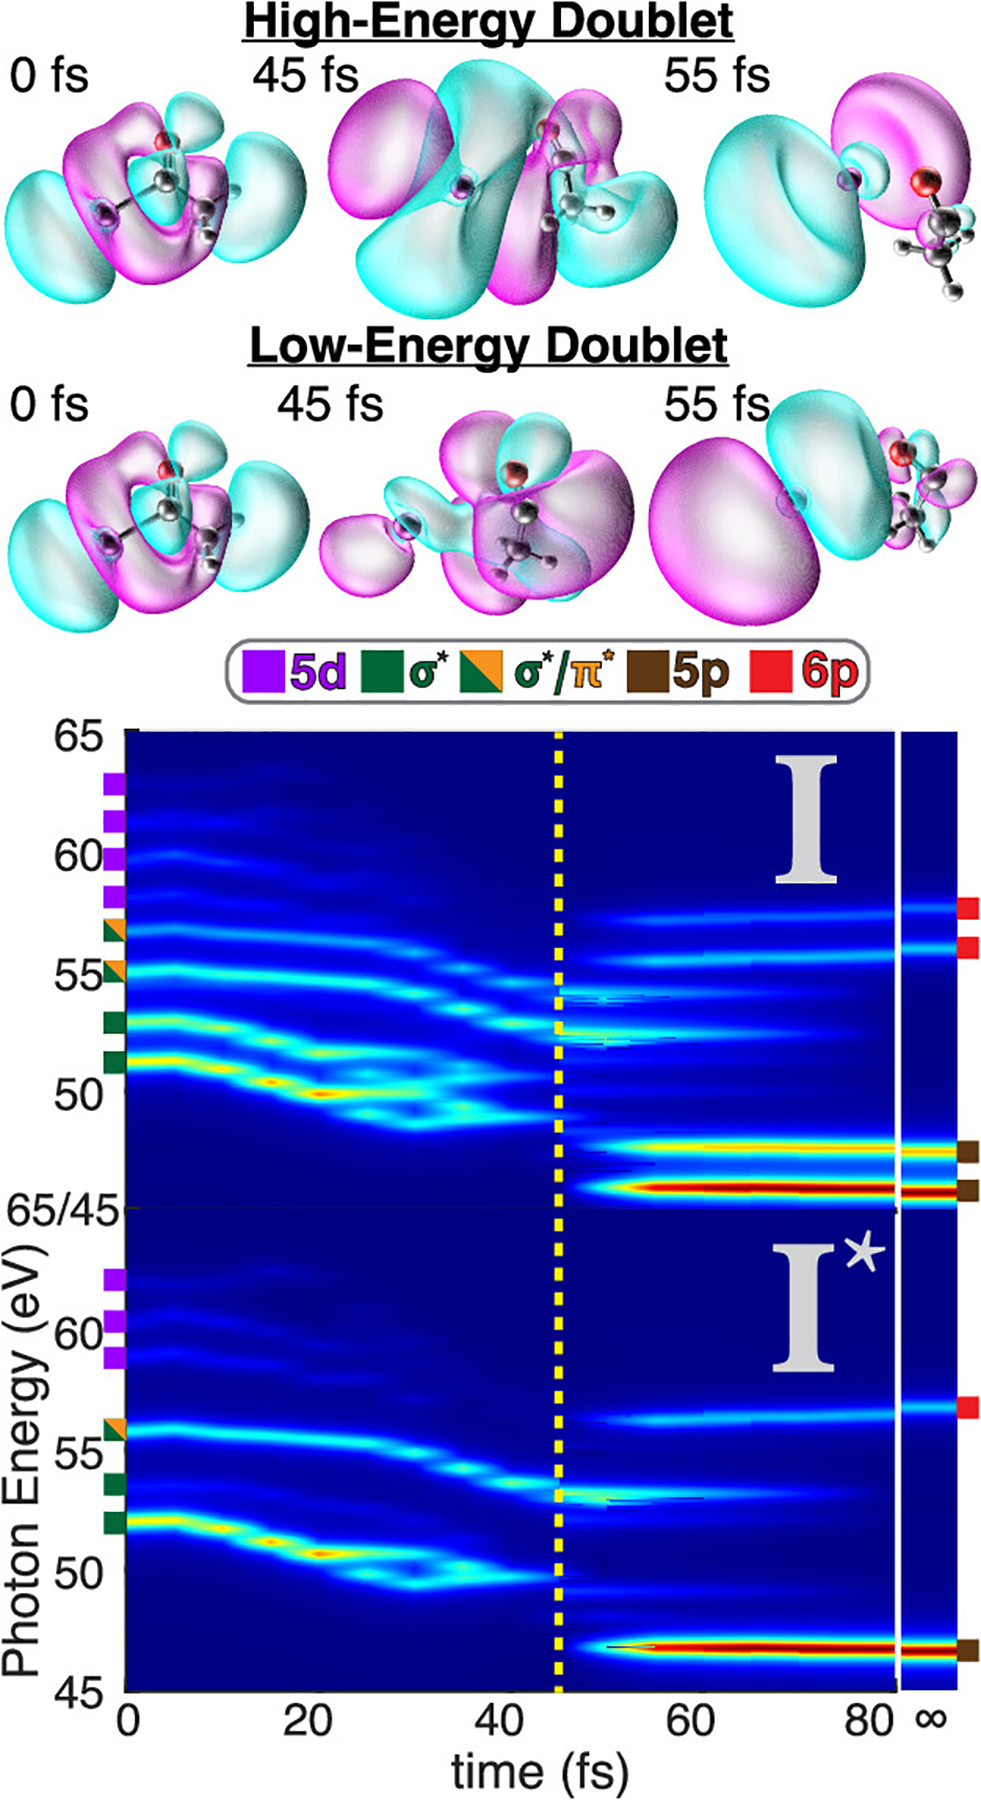
Figure 5.

False color map of the CVS-EOM-CCSD N4,5-edge spectrum along the nonadiabatic aiMD trajectory taken in 5 fs increments. The I (2P3/2) and spin–orbit excited I* (2P1/2) excitation channels are shown in the top and bottom spectra, respectively. Colored notches on the left and right sides indicate the transitions (4d→A, where A = 5d, σ*, σ*/π*, 5p, or 6p) that give rise to the features at t = 0 and 80 fs, respectively. The σ* orbitals that contribute to the four lowest-energy features in the AcI (2P3/2) spectrum are shown above the false color map. The initial σ* orbital (left) becomes distorted as the C–I bond breaks, yielding σ*-like orbitals that still exhibit significant hybridization between I and C2H3O fragments at t = 45 fs (center) just prior to bond breaking. After bond breaking (right), the primary transitions take on the character of pure iodine p orbitals. The spectrum of the iodine atom is shown after the break in the x axis as an approximation for t = ∞ to allow comparison to the finite-time spectra.
