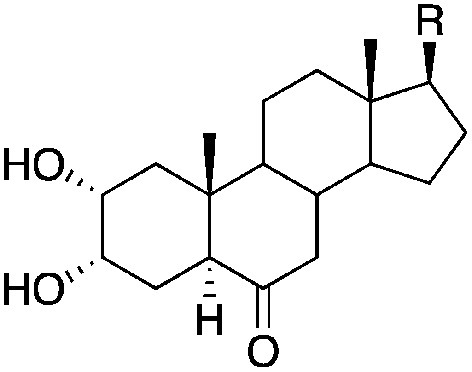
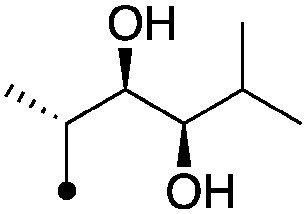
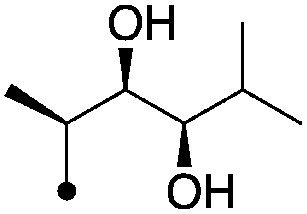
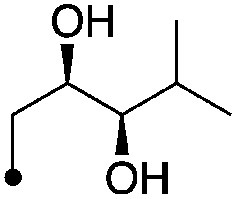
Table 1. The BL-like activity of various BRs and the ΔGbind to the BL receptor protein.
| BL-like activity | ΔGbindc) | ||||
|---|---|---|---|---|---|
| No. | Compounds | pMECa) | pED50b) | A. thaliana | O. sativa |
| 1 | BL | 10.5±0.23 (4) | 13.6 | −78.7±5.0 | −79.2±5.8 |
| 2 | CS | 8.5±0 (3) | 12.3 | −75.1±5.3 | −90.1±5.3 |
|
|||||
| R | |||||
| 3 |
|
8.0±0 (3) | 10.7 | −71.3±2.8 | −87.7±1.0 |
| 4 |
|
4.1±0.17 (3) | 8.5 | −67.3±3.7 | −80.9±3.7 |
| 5 |
|
4.3±0 (3) | 8.7 | −64.9±5.0 | −74.9±8.5 |
| 6 |
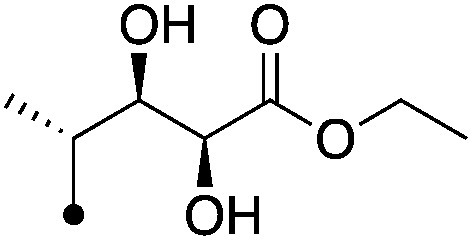
|
6.1±0 (3) | <10.0 (10%) | −72.4±3.1 | −75.2±10.8 |
| 7 |
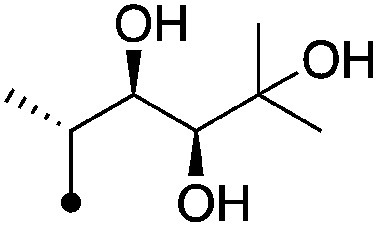
|
6.4±0.17 (3) | <9.0 (39%) | −69.2±3.8 | −77.6±1.3 |
| 8 |
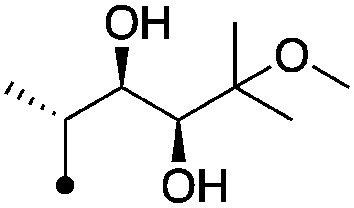
|
6.0±0.17 (3) | <9.2 (0.1%) | −71.8±2.1 | −84.1±2.0 |
| 9 |
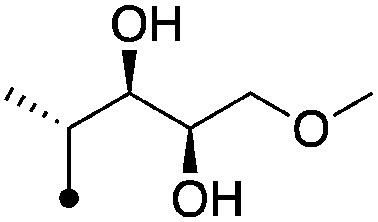
|
5.9±0.17 (3) | <9.3 (11%) | −67.5±3.3 | −85.3±4.0 |
| 10 |
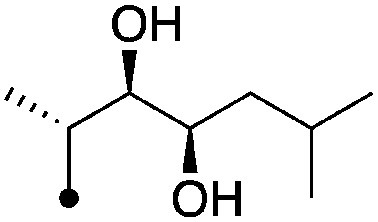
|
8.0±0.17 (3) | 10.2 | −72.6±3.9 | −87.4±6.4 |
| 11 |
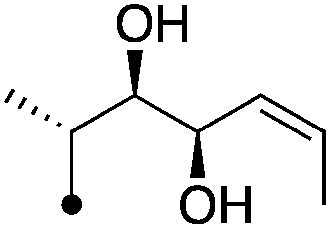
|
6.4±0.17 (3) | 9.5 | −70.0±6.7 | −82.2±9.0 |
| 12 |
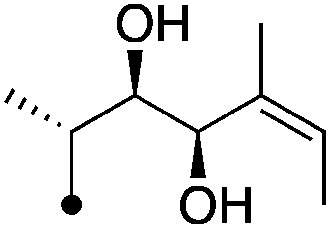
|
7.8±0 (3) | 10.7 | −75.0±6.1 | −80.8±1.4 |
| 13 |
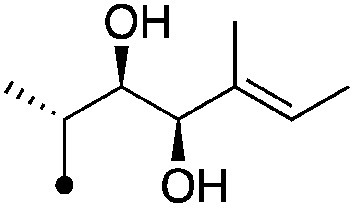
|
7.8±0 (3) | 11.3 | −69.4±6.0 | −79.4±4.5 |
| 14 |
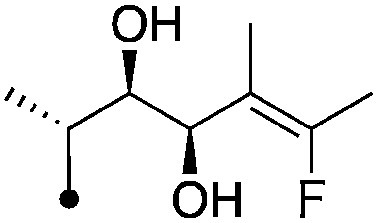
|
8.0±0.17 (3) | 10.8 | −73.0±5.0 | −86.7±6.6 |
| 15 |
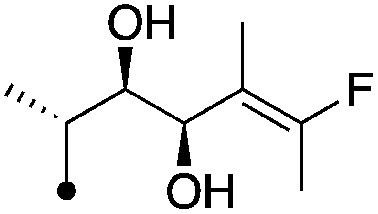
|
8.2±0.17 (3) | 11.2 | −68.4±2.2 | −83.5±0.4 |
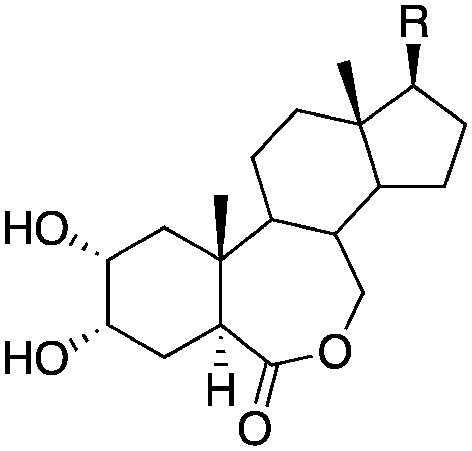
|
|||||
| R | |||||
| 16 |
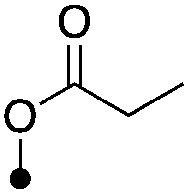
|
4.15±0.21 (2) | <8.0 (13%) | −57.3±2.5 | −75.3±3.2 |
| 17 |
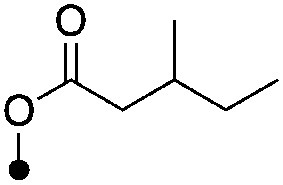
|
4.0±0.17 (3) | <8.0 (41%) | −66.1±1.6 | −78.6±1.6 |
| 18 |
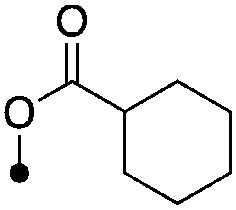
|
<4.3 (2) | <8.0 (48%) | −68.8±0.9 | −79.6±0.9 |
| 19 |
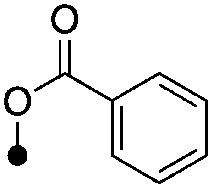
|
<4.3 (2) | <8.0 (44%) | −61.8±5.6 | −71.4±2.8 |
| 20 |
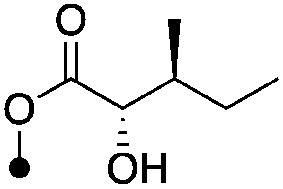
|
4.5±0.17 (3) | 9.3 | −60.6±4.9 | −72.8±4.9 |
| 21 |
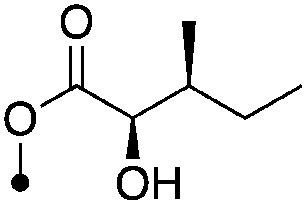
|
5.6±0 (3) | 10.5 | −69.6 ±2.7 | −82.5±6.6 |
| 22 |
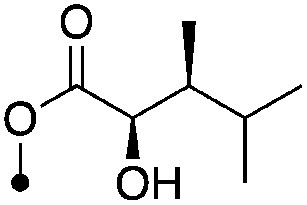
|
5.6±0 (3) | 10.1 | −64.5±3.1 | −83.7±6.5 |
| 23 |
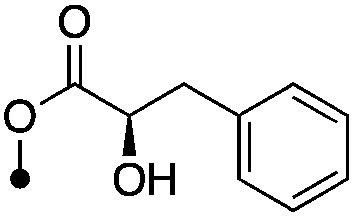
|
5.1±0 (3) | <8.7 (16%) | −67.8±4.8 | −72.8±4.4 |
| 24 |
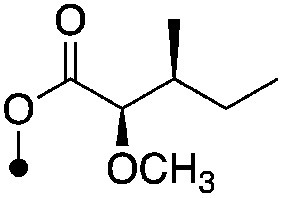
|
4.6±0 (3) | 9.1 | −62.1±5.5 | −81.4±2.5 |
a) Mean±standard deviation. The numbers in parentheses are the replication numbers. b) From Ref. 6–8. Measured by RLIA. The numbers in parentheses are the promotion of the lamina inclination at the corresponding dose. c) Mean±standard deviation for three calculations.
