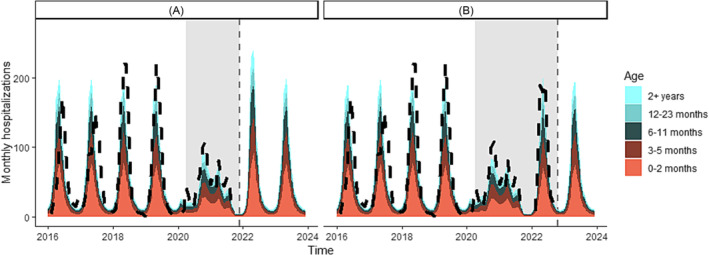
FIGURE 2.

Age‐structured model projections and observations of the monthly number of national RSV hospitalizations in South Africa at two time points. Model projections are represented in color, with different age groups represented based on the color bar on the right. The black dashed line represents observed hospitalizations as reported through SARI and the gray vertical line shows the end of the calibration data. Gray bars show the NPI period. (A) Model fit and prediction for the 2022 RSV reason in which we assumed that no NPIs would be in place after October 2021. (B) Model updates based on calibration to the 2022 RSV season and prediction for the 2023 season.
