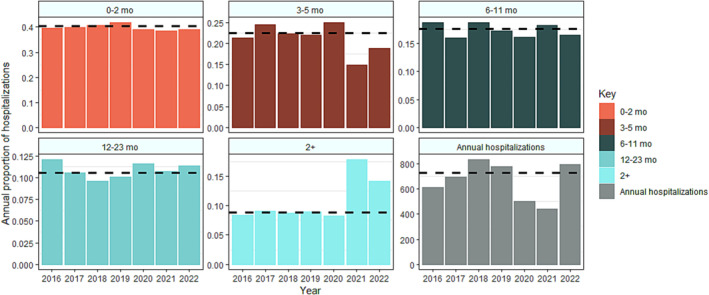
FIGURE 3.

Age distribution and number of infants hospitalized with laboratory‐confirmed RSV January 2016–December 2022, sentinel surveillance, South Africa. The first five panels represent the age shift in RSV surveillance data coinciding with the COVID‐19 pandemic. Each panel represents the proportion of annual hospitalizations observed in the 0–2‐month, 3–5‐month, 6–11‐month, 12–23‐month, and 2+‐year age groups alongside annual burden reported from 2016 to 2022. The last panel represents the total number of hospitalizations across all age groups by year. The dashed black line indicates the pre‐pandemic average for each panel.
