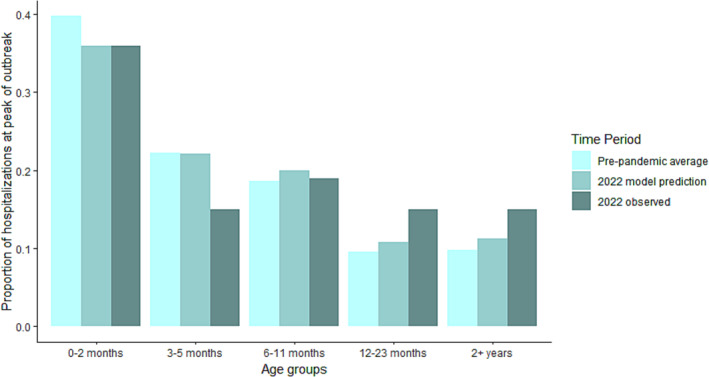
FIGURE 4.

Modeled age structure. Predictions for the age structure at the peak month of the 2022 season compared with the modeled pre‐pandemic average and the 2022 observed season. The model generally captures the age shift observed in empirical data, with infants <6 months comprising a smaller proportion of the hospital burden. The model predicts the largest proportional increase in hospitalizations to be among children >12 months.
