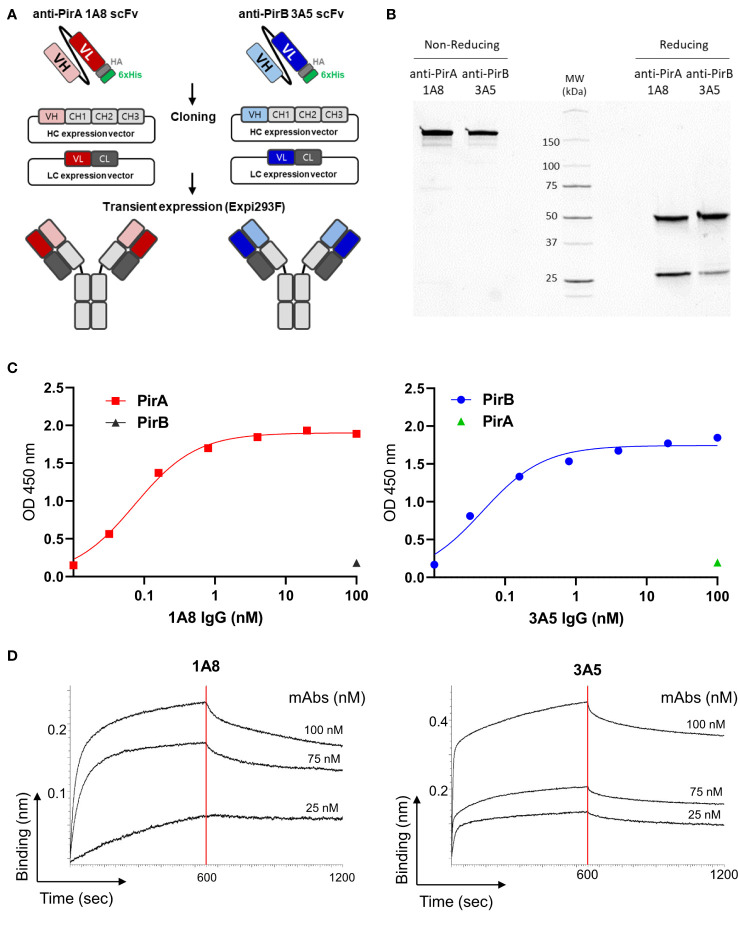
Figure 3.
Production and validation of 1A8 and 3A5 IgGs. (A) Schematic illustration of transition of scFv to IgG form. VH and VL chains of the selected scFvs were separately cloned into HC and LC expression vectors containing constant regions, respectively; HC and LC expression vectors constructed for each antibody were transiently co-transfected into Expi293F cells. (B) Purification of 1A8 and 3A5 IgGs. IgGs expressed in supernatants were purified by protein A column and analyzed by SDS-PAGE to evaluate their intact sizes, approximately 150 kDa in non-reducing condition, and 50 kDa (HC) and 25 kDa (LC) in reduction condition. (C) Validation of the binding activity of 1A8 and 3A5 IgGs. Dose-dependent binding of 1A8 and 3A5 IgGs was assessed using PirA (left) and PirB (right) by ELISA, respectively. (D) Affinity measurement by biolayer interferometry. PirA or PirB (200 nM) was immobilized on an AR2G biosensor and allowed to bind to 1A8 (left) or 3A5 (right) IgG (25, 75, and 100 nM). Kinetic rates and equilibrium binding constants were analyzed using global fitting analysis of the binding curves.

