FIGURE 4.

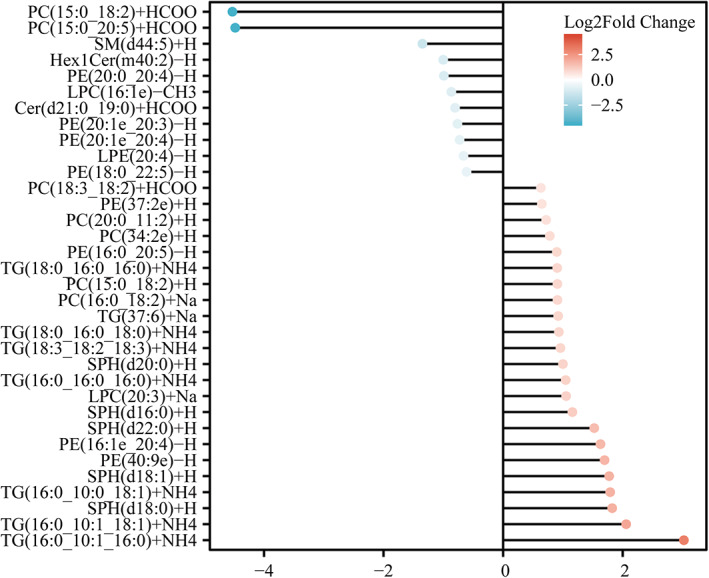
Different lipid metabolites of aMCI and NC. The value of the dot indicates the log2 fold change values, with red indicating that lipid metabolites are up‐regulated and blue indicating that lipid metabolites are down‐regulated.

Different lipid metabolites of aMCI and NC. The value of the dot indicates the log2 fold change values, with red indicating that lipid metabolites are up‐regulated and blue indicating that lipid metabolites are down‐regulated.