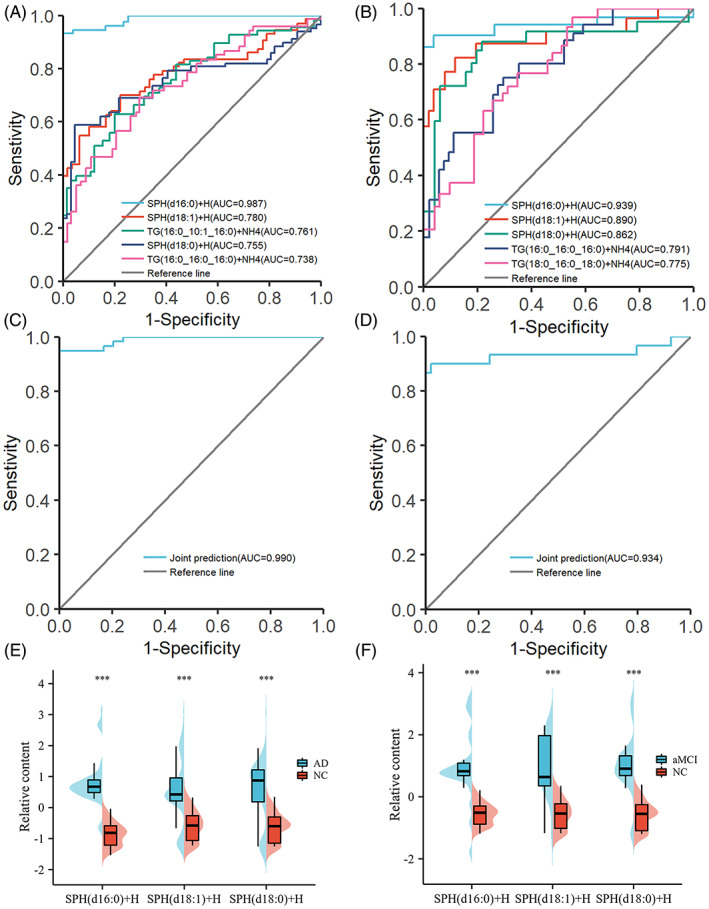
FIGURE 6.

(A) Receiver operating characteristic (ROC) curve used to differentiate between AD and NC subjects. (B) ROC curve used to differentiate between aMCI and NC subjects. (C) ROC curves of the three SPHs (SPH (d16:0) + H, SPH (d18:1) + H, and SPH (d18:0) + H) for joint prediction of AD. (D) ROC curves of the three SPHs (SPH (d16:0) + H, SPH (d18:1) + H, and SPH (d18:0) + H) for joint prediction of aMCI. (E) Comparison of three SPHs between AD and NC. (F) Comparison of three SPHs between aMCI and NC. The Mann–Whitney U test was used to compare the two groups, *p < 0.05; **p < 0.01; ***p < 0.001.
