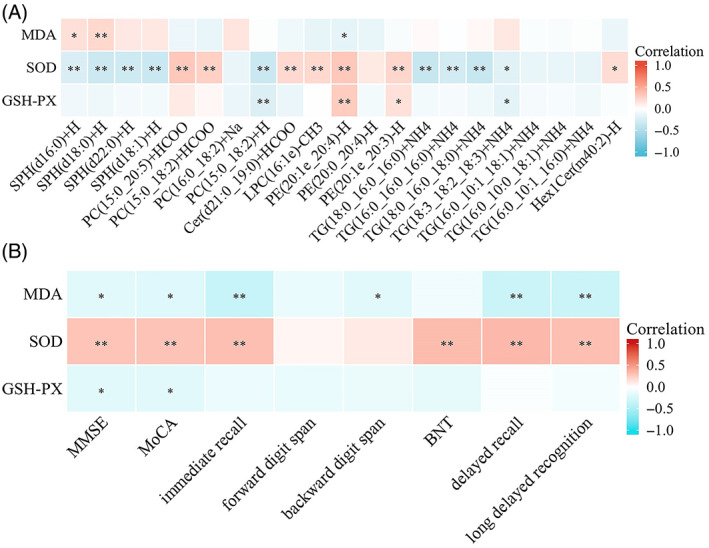
FIGURE 8.

(A) Correlation of co‐altered lipid metabolites with oxidative stress. (B) Correlation of oxidative stress markers with cognitive function. Warm colours (red) are positively correlated and cool colours (blue) are negatively correlated. Adjusted for age, gender and education level. BNT, Boston Naming Test. *p < 0.05; **p < 0.01.
