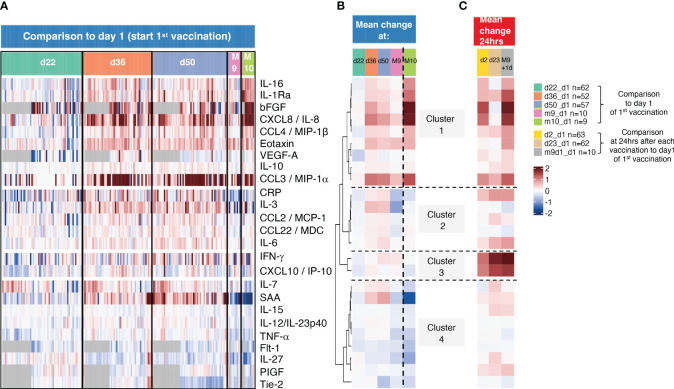
Figure 4.
Sequential analysis of biomarkers with longer-lasting changes. (A) The heatmap shows log2 fold changes comparing all sequential measurements to the day 1 measurements before the 1st vaccination. d22 samples were collected before 2nd vaccination, d36, d50, and M9 before the 3rd vaccination and M10, one month after the 3rd vaccination. Grey cells denote missing values for five analytes not measured for 22 participants. (B, C) Mean log2 fold changes for each analyte and for (B) data obtained d22, d36, d50, M9 and M10 from (B, C) and data obtained 24hrs after the 1st, 2nd, and the 3rd vaccination (d2, d23, m9+d1).

