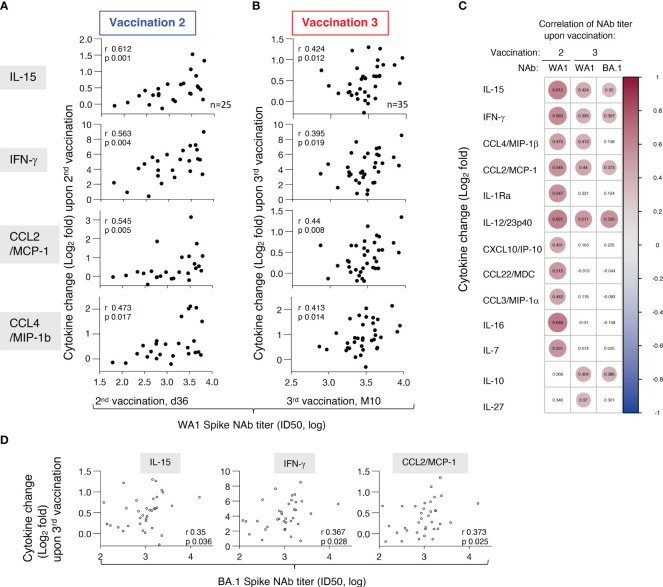
Figure 6.
Association of biomarkers and vaccine-induced humoral immune responses. Univariate correlations of log2 fold changes of selected cytokines (IL-15, IFN-γ, CCL2/MCP-1, CCL4/MIP-1β, IL-1Ra) after the (A) 2nd vaccination (d23 vs d22) and (B) 3rd vaccination (M9 + 1d vs M9) and levels of anti-Spike (WA1) NAb, measured at d36 and M10, respectively. Spearman r and p values are given (calculated in R). Note the different scales of the X-axis after the 2nd and 3rd vaccination, with a tighter spread of NAb responses after the 3rd vaccination. (C) Pairwise Spearman correlations for analytes with positive correlations between cytokine fold changes and NAb titers against WA1 after the 2nd and 3rd vaccination and NAb titers against BA.1 after the 3rd vaccination. Significant correlations (p-value < 0.05) are represented by circles whose size and coloring correspond to the value of the Spearman correlation r values (calculated in R). (D) Univariate correlations of log2 fold changes of selected cytokines (IL-15, IFN-γ, CCL2/MCP-1) after the 3rd vaccination (M9 + 1d vs M9) and levels of anti-Spike BA.1 NAb, measured at M10. Spearman r and p values are given (calculated in R).

