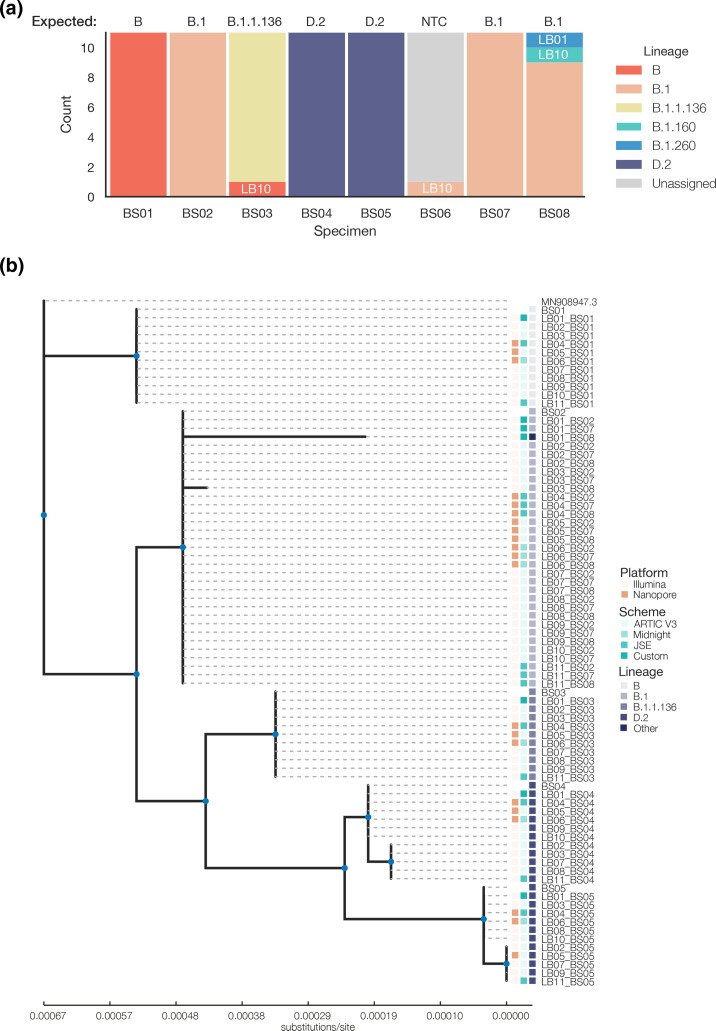
Fig. 2.
Key surveillance metrics derived from consensus genomes submitted. (a) Pangolin lineage assignments from consensus genomes submitted. Participant ID annotated where discordant. (b) Maximum-likelihood tree of consensus genomes submitted, excludes genomes<50 % coverage; and BS03 and BS08 for LB10. Nodes with teal markers indicate branch support >80 %. The heatmap denotes the sequencing platform, primer scheme, and PANGO lineage called for each tip. Phylogenetic tree visualized with toytree v1.0 (https://github.com/eaton-lab/toytree).

