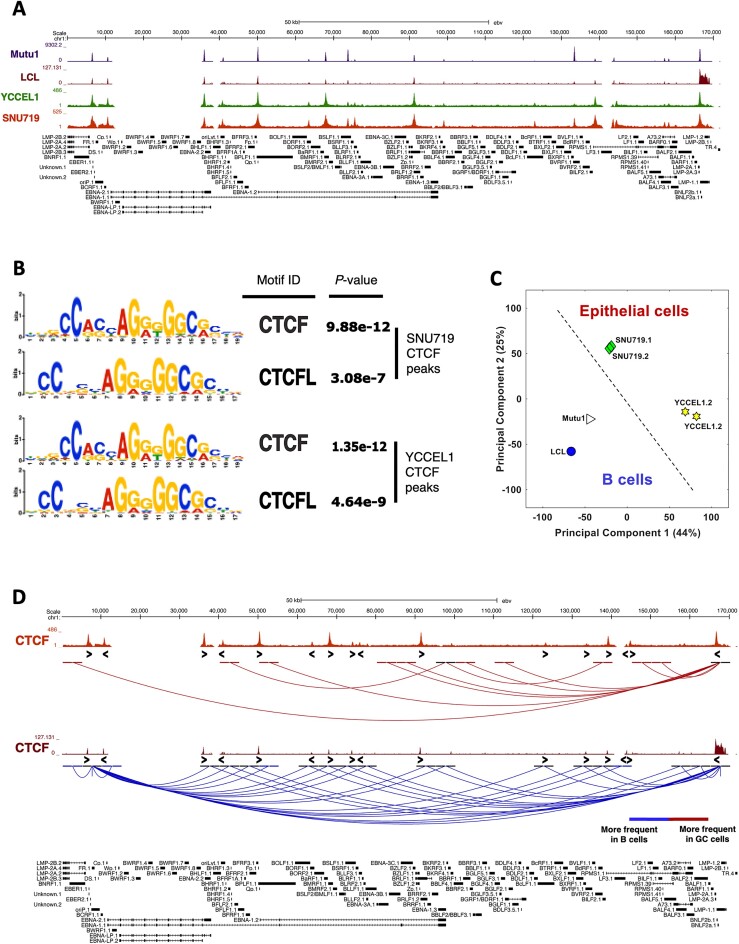
Figure 1.
The three-dimensional structure of the viral genome differs in all latency types and reflects the viral gene expression state. (A) CTCF ChIP-seq profiles in latency Type I (Mutu, purple), III (LCL, brown) and II (YCCEL1, green and SNU719, dark red), normalized to input DNA. (B) Motif analysis for the CTCF ChIP-seq peaks identified in the latency Type II cell lines. (C) Principal Component Analysis (PCA) based on the 3D structure of the viral genome. (D) UCSC Genome Browser linearized visualization of the unique interactions found in HiC experiment in gastric cancer cell lines (dark red) and in B cells (blue) (FDR < 5%). CTCF motif directionality is represented by arrowheads under CTCF ChIP-seq peaks.

