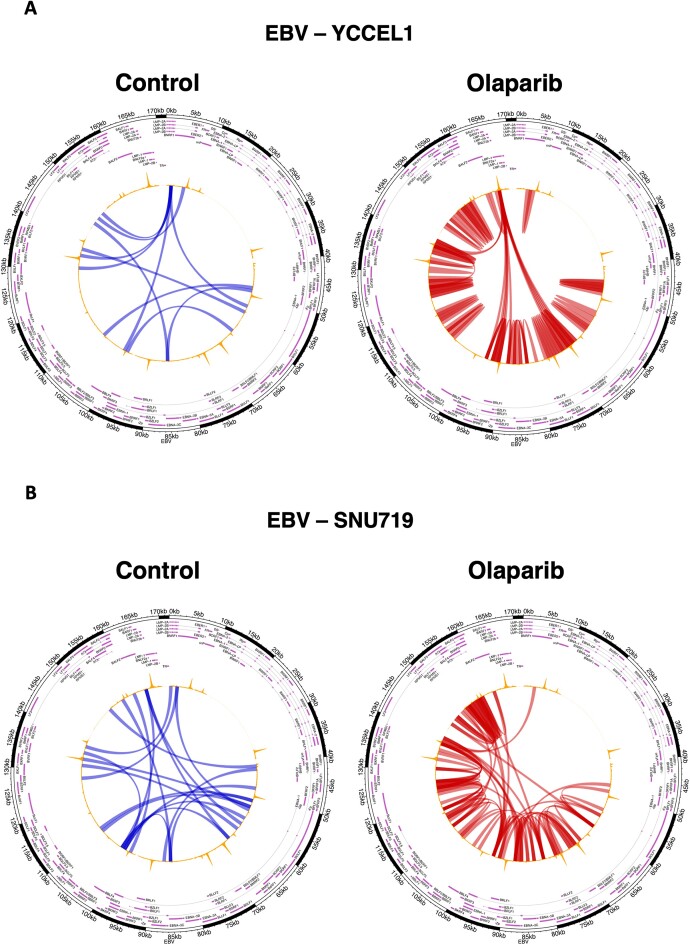
Figure 3.
Viral chromatin looping is altered by PARP1 inhibition. (A) Circular visualization of the interactions derived from HiC matrices in YCCEL1 cell line. The arches represent the DNA-DNA interactions at 1 kb scale. The blue arches represent the interactions found more frequently in the control samples, while the red ones represent those found more frequently in the Olaparib treated samples (FDR < 5%). (B) Circular visualization (as described in A) of the interactions derived from HiC matrices in SNU719 cell line. In all plots CTCF ChIP-seq track is represented in yellow on top of the arches.

