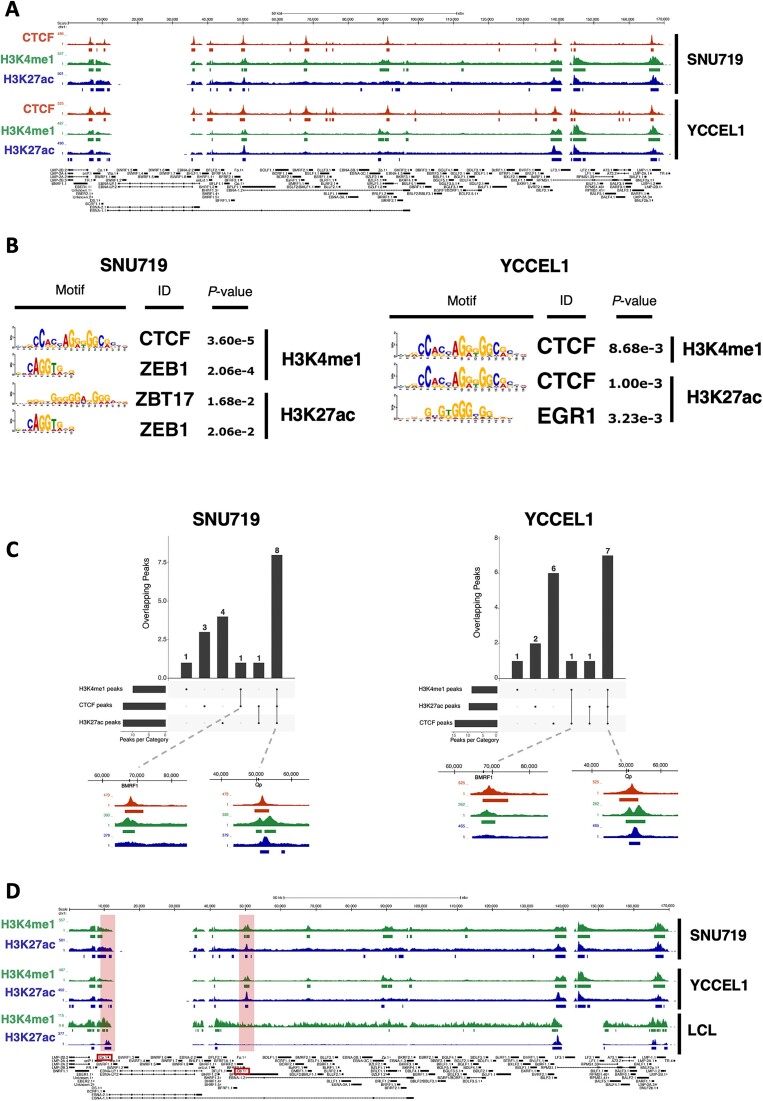
Figure 5.
CTCF co-localizes with enhancer histone marks. (A) UCSC Genome Browser tracks for CTCF (dark red), H3K4me1 (green), H3K27ac (blue) on the EBV genome in both SNU719 (top) and YCCEL1 (bottom) cell lines. (B) Transcription factor motif analysis for H3K4me1 (top) and H3K27ac (bottom) peaks in SNU719 (left) and YCCEL1 (right) cell lines. (C) UpSet plot of the overlap between CTCF and H3K4me1 and H3K27ac histone marks. On the bottom, magnified ChIP-seq tracks for CTCF and both histone marks are shown. (D) H3K4me1 and H3K27ac ChIP-seq tracks on the EBV genome in SNU719 (top), YCCEL1 (middle) and LCL (bottom) cell lines.

