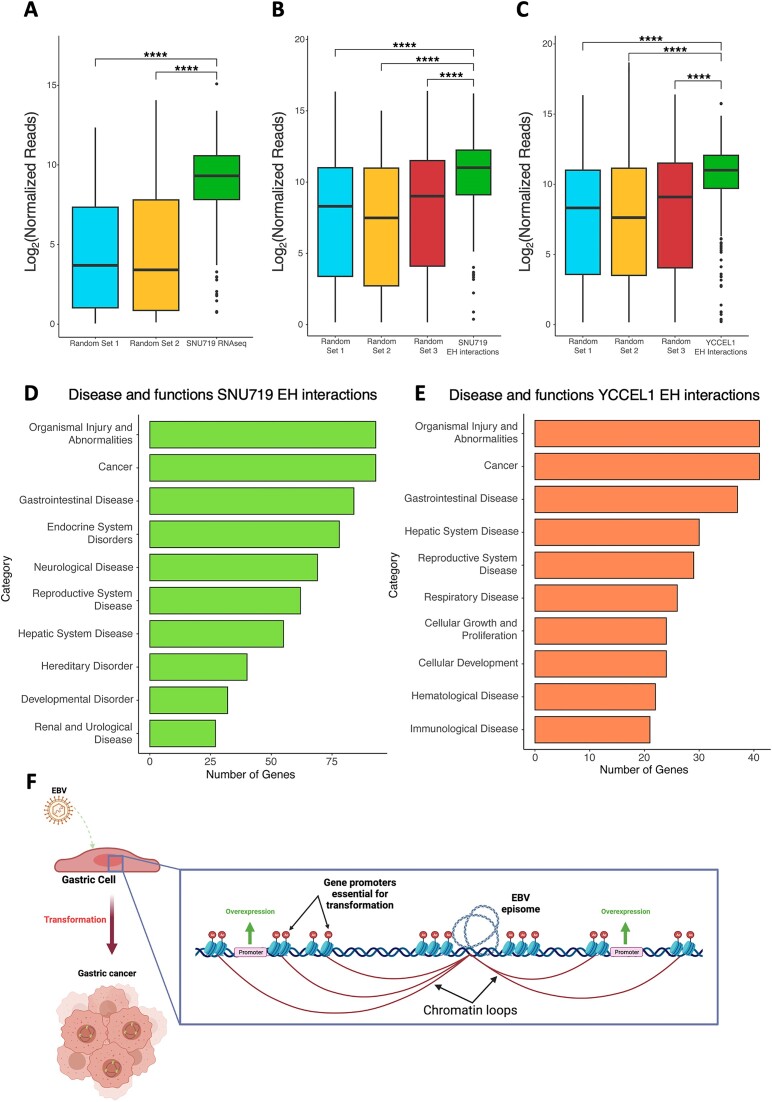
Figure 8.
Functional role of EBV–human interactions: gene expression analysis reveals strong viral enhancers associated with gastric cancers. (A) Boxplot comparing the normalized reads for genes near EBV–human interactions to two different random gene sets in SNU719 cell line (****P ≤ 0.0001). (B) Boxplot comparing the normalized reads for genes near EBV–human interactions found in SNU719 to three different random gene sets in TCGA datasets from biopsies of EBV + gastric malignances (****P ≤ 0.0001). (C) Boxplot (as described in B) for EBV–human interactions found in YCCEL1 cell line (****P ≤ 0.0001). (D) Ingenuity Pathway Analysis (IPA) of genes found near EBV–human interaction sites in SNU719 cell line. (E) IPA (as described in D) of genes found near EBV–human interaction sites in YCCEL1 cell line. (F) Model of the supposed mechanism of EBV-driven cell transformation. The figure was created with BioRender.com.

