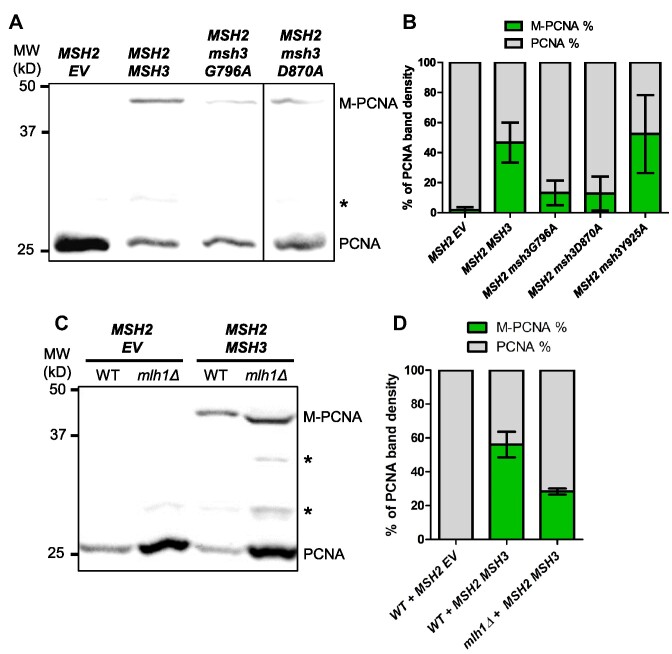
Figure 11.
MSH2 MSH3 overexpression induces PCNA post-translational modification in an ATP binding-and hydrolysis-dependent manner. MSH2 and MSH3 or msh3 alleles were overexpressed in a msh3Δ (A) or mlh1Δ (C) background, as previously described. Western blot for PCNA. Modified PCNA is marked as M-PCNA. The data in (A) are from a single blot, but not adjacent lanes, as indicated by the vertical line. (B, D) PCNA western blot quantification as previously described. Pairwise t-tests were performed to determine whether the differences in the proportion of M-PCNA were significant. We observed significant differences between MSH2 MSH3 and MSH2 msh3G796A or MSH2 msh2D870A (P< 0.0001), but not MSH2 msh3Y925A (P = 0.6901). We also observed significant differences between MLH1 and mlh1Δ backgrounds (P = 0.0332).

