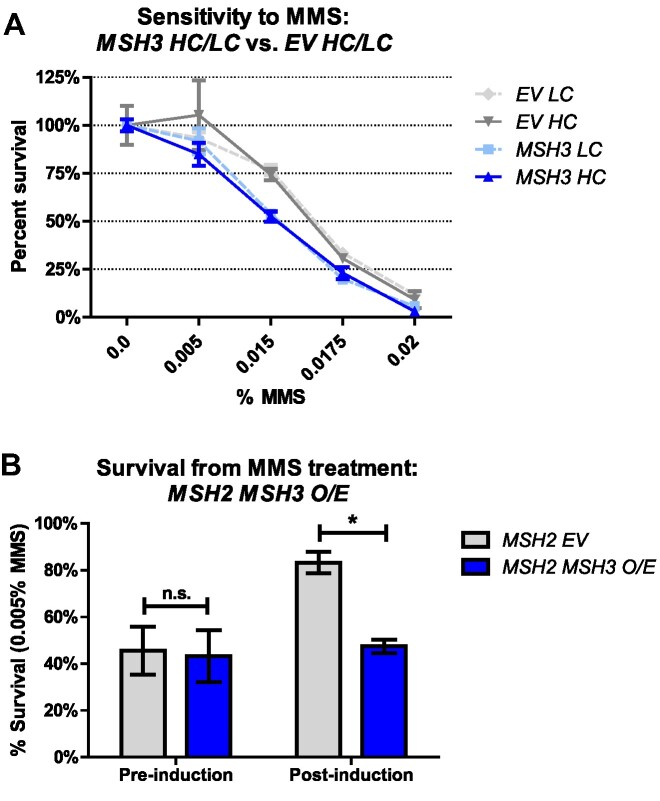
Figure 2.
Elevated MSH3 expression renders cells sensitive to methyl methanesulfonate (MMS). (A) MMS sensitivity of msh3Δ strains carrying either a low-copy (MSH3 LC, light shade) or high-copy number (MSH3 HC, dark shade) plasmid containing either empty vector (EV, gray lines) or MSH3 (blue lines) were grown in increasing concentrations of MMS. Plotted graphs represent at least two independent experiments done in triplicate and with at least two independent transformants. Error bars were calculated by SEM; P values (two-way ANOVA) were calculated in Prism (MSH3 LC versus EV LC P < 0.0001; MSH3 HC versus EV HC, P = 0.0317). (B) MMS sensitivity of msh3Δ strains co-overexpressing MSH2 and MSH3. Cultures were grown to mid-log phase and MSH3 expression was induced by the addition of galactose. Time point 17 h after induction was collected, serial diluted and plated onto SC agar plates in the absence or presence of 0.005% MMS. Plotted data represents the results of at least three independent experiments. Error bars represent the SEM; P values (two-way ANOVA) were calculated in Prism (*P = 0.0297).

