Figure 5.
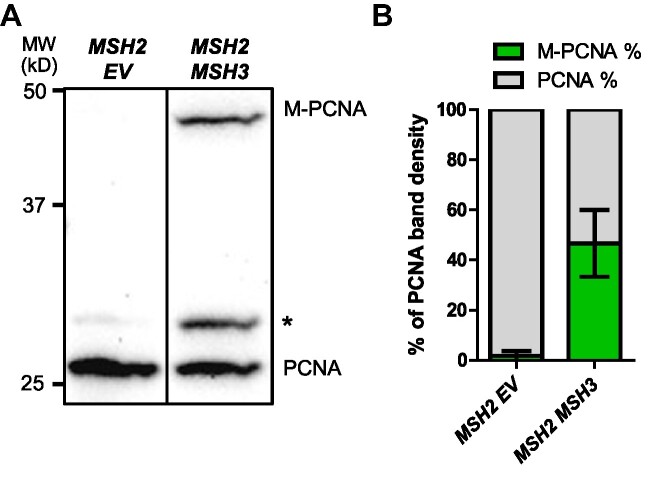
MSH2 MSH3 overexpression induces post-translational modification of PCNA. MSH2 and MSH3 or empty vector (EV) were overexpressed in a msh3Δ background, as previously described. Following induction, TCA protein extracts were prepared, and the proteins were separated by 12% SDS-PAGE, transferred onto a membrane and then probed with anti-PCNA (P4D1), a gift from the Stillman lab. (A) Western blot for PCNA. Modified PCNA is marked as M-PCNA. The asterisk indicates non-specific bands. These data are from a single blot, but not adjacent lanes, as indicated by the vertical line. (B) PCNA western blot quantification, shown as relative band densities of modified versus unmodified PCNA in terms of the percentage of total PCNA signal (measured as the sum of unmodified and modified bands). A pairwise t-test was performed to test significance of the difference in the proportion of M-PCNA; P< 0.0001.

