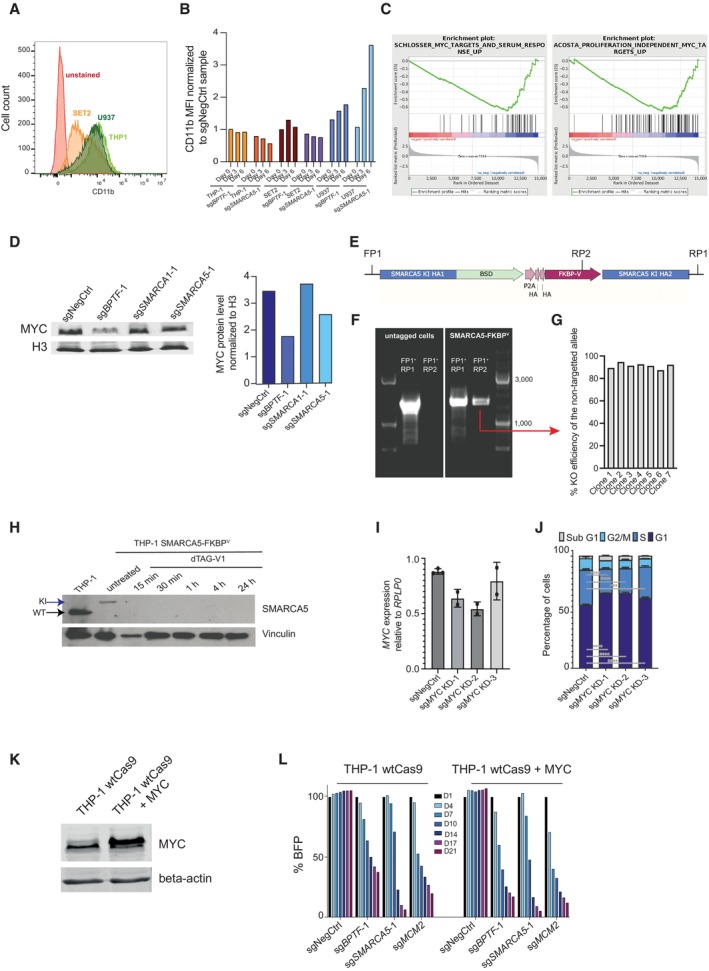
Figure EV2. BPTF and SMARCA5 sustain the expression of MYC and MYC‐regulated genes.

- Flow cytometry histogram depicting CD11b levels in three cell lines: SET2, U937, and THP‐1.
- The median fluorescent intensity of CD11b in THP‐1, SET2, and U937 cells after knocking out either BPTF or SMARCA5. The levels were normalized to the cells that were transduced with the non‐targeting sgRNA.
- Enrichment plots for MYC target genes among the downregulated genes after BPTF KO (GSEA categories: SCHLOSSER_MYC_TARGETS_AND_SERUM_RESPONSE_UP and ACOSTA_PROLIFERATION_INDEPENDENT_MYC_TARGETS_UP).
- Western blotting analysis of MYC protein levels (left) and their quantification (right) after BPTF, SMARCA1 and SMARCA5 KOs.
- Schematic representation of genotyping primers used to verify the successful knock‐in.
- Agarose gel image after the PCR using the genotyping primers represented in (E) on either wild‐type THP‐1 cells or the SMARCA5 degron knock‐in cells.
- KO efficiency graph generated using TIDE for the untargeted SMARCA5 locus in the individual clones generated from the SMARCA5 degron knock‐in cell pool.
- Western blotting analysis of SMARCA5 protein expression in wild‐type and SMARCA5 degron knock‐in cells upon treatment with dTAG‐V1 (100 nM). WT stands for wild‐type and KI—for knock‐in.
- qRT‐PCR analysis for the expression of MYC in THP‐1 cells transduced with a non‐targeting sgRNA or three different mixes of two MYC KD sgRNAs, as downregulation of MYC was insufficient using only one sgRNA, n = 3 biological replicates (independent cell transductions) for negative control and n = 2 biological replicates (independent cell transductions) for the remaining samples. Data are normalized to RPLP0 and shown as mean ± SD (one‐way ANOVA followed by Dunnett's multiple comparisons test was performed to assess significance, *P < 0.05). The experiment was performed twice with similar results.
- Cell cycle analysis of the THP‐1 cells transduced with a nontargeting sgRNA or MYC KD sgRNAs (n = 3 biological replicates, i.e., independent cell transductions). Data are shown as mean ± SD.
- Western blot for MYC and beta‐actin in wild‐type THP‐1 cells and THP‐1 cells with MYC overexpression.
- Competition assay after BPTF or SMARCA5 KO in wild‐type or MYC‐overexpressing THP‐1 cells. The cells were transduced with the lentiviral cassettes expressing the corresponding sgRNAs and BFP and mixed with untransduced cells. The percentage of BFP‐positive cells was measured over time. The data were normalized to Day 1.
Source data are available online for this figure.
