
Figure 5. The NURF complex facilitates CTCF binding and chromatin insulation.
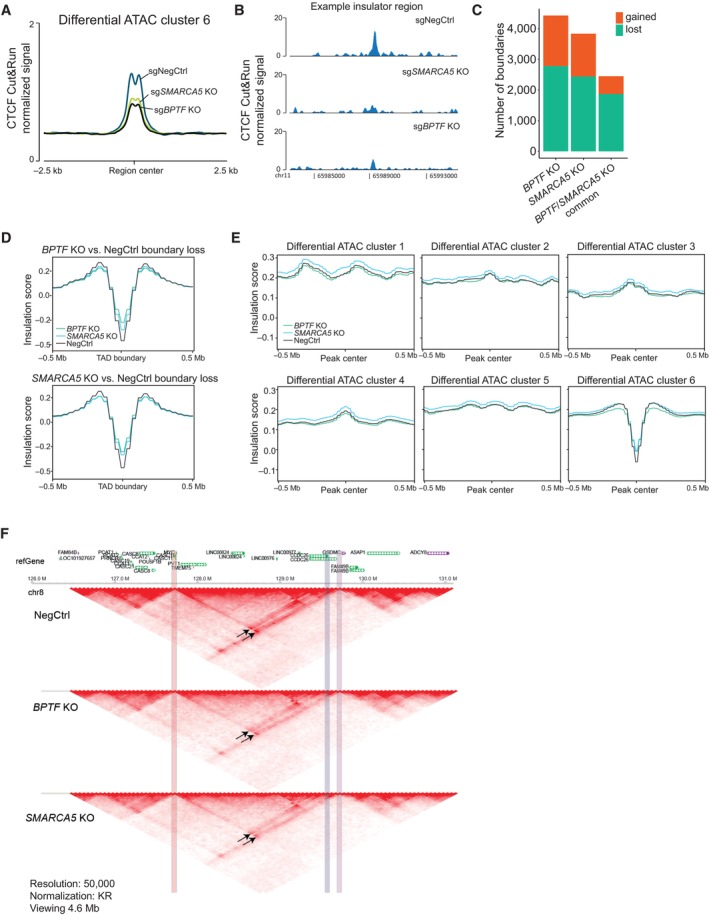
- Average profile of CTCF Cut&Run signal across the ATAC‐seq peaks decreased after the NURF KO (cluster 6) in THP‐1 wtCas9 cells.
- CTCF binding at a representative insulator region in THP‐1 wtCas9 cells transduced with the indicated sgRNAs.
- The number of changed TAD boundaries between the BPTF or SMARCA5 KO and wild‐type, and the number of boundaries commonly changed in the two KOs.
- Average insulation score profiles across all the boundaries lost upon BPTF (top) and SMARCA5 (bottom) KO.
- Average insulation score profiles across the differential ATAC‐seq clusters.
- Hi‐C data snapshots at 25 kb resolution from negative control, BPTF and SMARCA5 KO samples. MYC promoter region is highlighted in red. MYC enhancer sites are highlighted in blue (interaction loop 1) and purple (interaction loop 2). The interaction loops are indicated with arrows.
Data information: The CTCF Cut&Run experiment was performed three times with similar results, each in two biological replicates. The HiC experiment was performed in two biological replicates (independent cell transductions) that were pooled together at the analysis stage to increase sequencing depth.
Source data are available online for this figure.