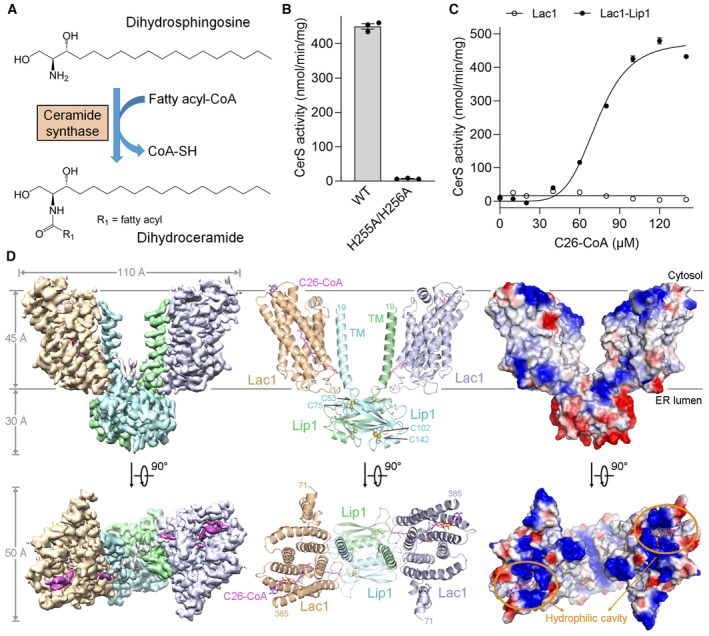
Figure 1. Biochemical and structural characterization of the yeast Lac1‐Lip1 complex.

- Ceramide synthase (CerS) catalyzes ceramide formation via N‐acylation of a sphingoid base with a fatty acyl‐CoA. Dihydrosphingosine (DHS), a representative sphingoid base, was used to generate dihydroceramide in the activity assays in this study.
- Enzymatic activity of the wild‐type (WT) Lac1‐Lip1 complex and the catalytic mutant Lac1H255A/H256A‐Lip1 complex. Each data point is the average ± SEM of three independent experiments.
- CerS activity versus C26‐CoA concentration for the Lac1 alone protein and the Lac1‐Lip1 complex. The activity curve of the Lac1‐Lip1 complex follows an allosteric sigmoidal equation with a Khalf of 72.99 ± 1.44 μM for C26‐CoA and a V max of 475.7 ± 13.1 nmol/min/mg. Each data point is the average ± SEM of three independent experiments.
- Perpendicular views of the cryo‐EM map, overall structure, and electrostatic potential surface of the C26‐CoA‐bound Lac1‐Lip1 complex. Lac1 and Lip1 form a heterotetramer with a 2:2 stoichiometry. C26‐CoA lies inside the Lac1 subunit and traverses the lipid bilayer. The two Lac1 subunits are shown in wheat and light blue, respectively; the two Lip1 subunits are shown in light cyan and light green, respectively; C26‐CoA is shown in magenta. The two intramolecular disulfide bonds within Lip1 are shown in spheres. TM, transmembrane helix.
Source data are available online for this figure.
