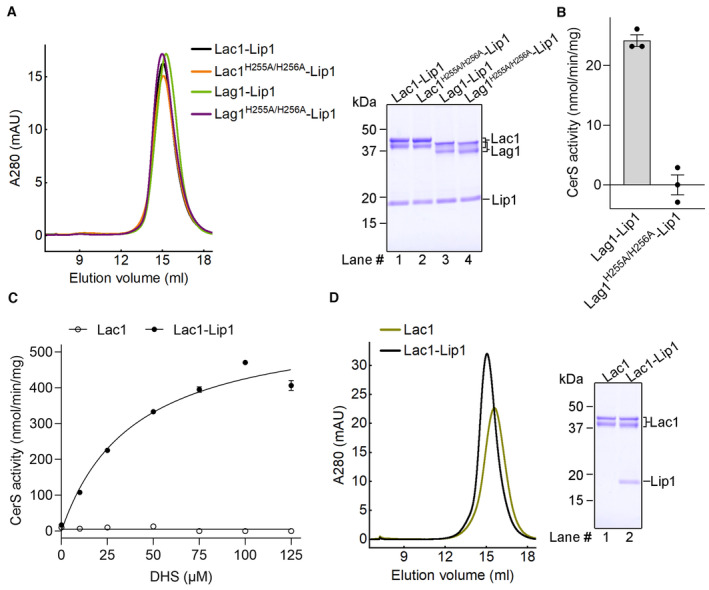
Figure EV2. Biochemical characterization of the Lac1‐Lip1 and Lag1‐Lip1 complexes.

- Size exclusion chromatography (SEC) profiles and Coomassie blue‐stained SDS‐PAGE gel of the purified Lac1‐Lip1 and Lag1‐Lip1 complexes.
- Enzymatic activity of the WT Lag1‐Lip1 complex and the catalytic mutant Lag1H255A/H256A‐Lip1. Each data point is the average ± SEM of three independent experiments.
- CerS activity versus DHS concentration for the Lac1 alone protein and the Lac1‐Lip1 complex. The activity curve of the Lac1‐Lip1 complex follows a Michaelis–Menten equation with a K m of 39.44 ± 6.29 μM for DHS and a V max of 593.3 ± 34.5 nmol/min/mg. Each data point is the average ± SEM of three independent experiments.
- SEC profile and Coomassie blue‐stained SDS‐PAGE gel of the Lac1 alone protein and the Lac1‐Lip1 complex.
