
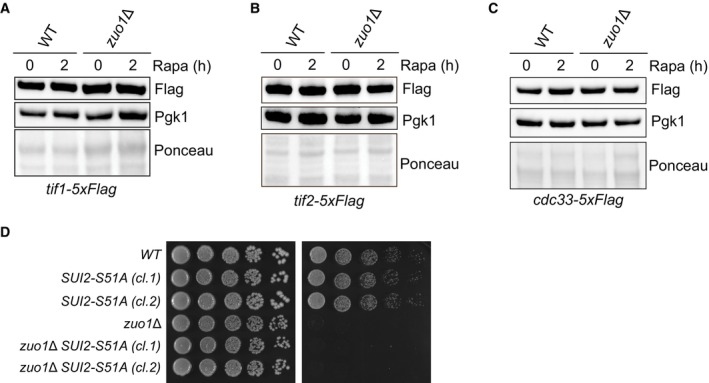
Figure EV4. Abundance of eIF4F subunits upon TORC1 inhibition.
-
A–CImmunoblot analysis of lysates from WT and zuo1Δ cells containing TIF1‐5xFLAG (A), TIF2‐5xFLAG (B), or CDC33‐5xFLAG (C) at the endogenous locus treated with 200 nM rapamycin for 2 h or left untreated. Ponceau and Pgk1 staining served as the loading control.
-
DFivefold serial dilutions of the indicated strains grown on YEPD plates with or without 20 ng/ml rapamycin for 4 days at 30°C.
Source data are available online for this figure.