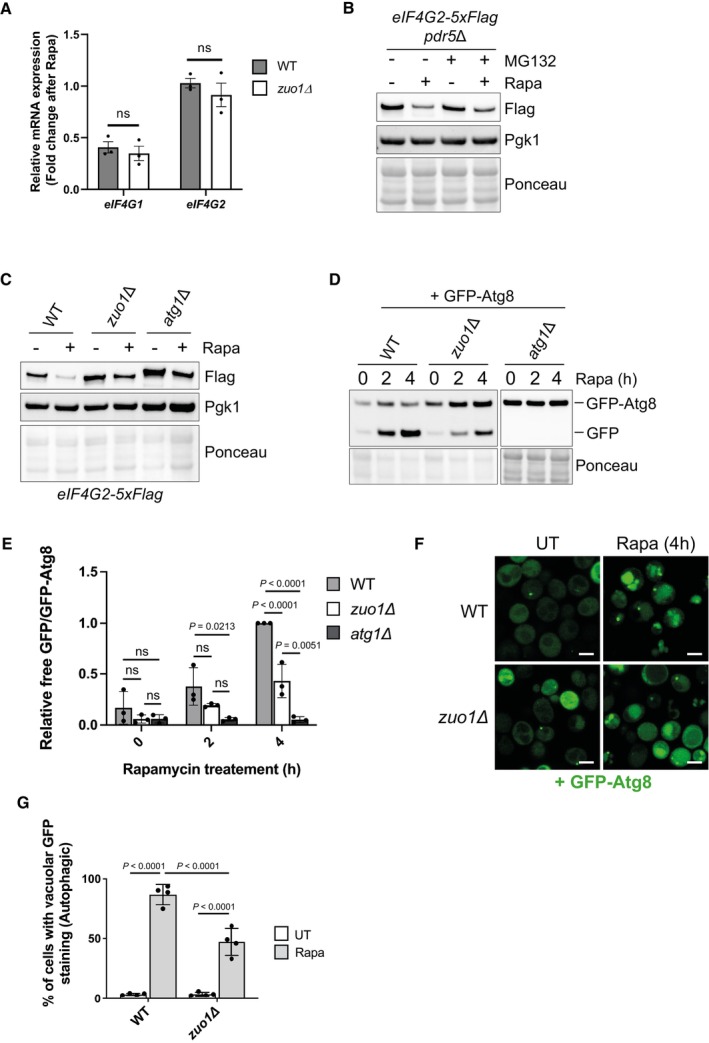
Figure 8. Zuo1 controls eIF4G degradation through autophagy.

- mRNA levels of eIF4G1 and eIF4G2 from WT and zuo1Δ cells treated with 200 nM rapamycin for 2 h or left untreated were analysed by qRT‐PCR. The fold change in mRNA levels in rapamycin‐treated conditions relative to UT conditions is presented as the mean ± s.e.m. Expression of eIF4G1 and eIF4G2 mRNA was normalised to the housekeeping gene ALG9. Statistical significance was assessed using multiple unpaired t‐test (n = 3 independent biological replicates). n.s. (not significant).
- Immunoblot analysis of lysates from pdr5Δ cells containing eIF4G2‐5xFLAG at the endogenous locus treated with 200 nM rapamycin and 50 μM MG‐132, where indicated, for 2 h or left untreated. Ponceau and Pgk1 staining served as the loading control.
- Immunoblot analysis of lysates from WT, zuo1Δ and atg1Δ cells containing eIF4G2‐5xFLAG at the endogenous locus treated with 200 nM rapamycin for 2 h or left untreated. Ponceau and Pgk1 staining served as the loading control.
- Immunoblot analysis of lysates from WT, zuo1Δ and atg1Δ cells expressing GFP‐Atg8 on a plasmid treated with 200 nM rapamycin for the indicated time or left untreated. Ponceau staining served as the loading control. Samples were run on the same gels and analysed on the same membrane, but intervening lanes were removed for clarity.
- Graph shows densitometry analysis (mean ± s.d.) of the relative abundance of GFP‐Atg8 and free GFP from (D), relative to the 0 h time point. Statistical significance was assessed using two‐way ANOVA t‐test (n = 3 independent biological replicates). n.s. (not significant).
- Representative microscopy images of WT and zuo1Δ cells expressing GFP‐Atg8 on a plasmid and treated with 200 nM rapamycin for 4 h or left untreated. n = 4 biologically independent experiments. Scale bars = 3 μm.
- Graph displays the proportion of WT and zuo1Δ cells with GFP‐Atg8 staining in the vacuole in both untreated cells and following 4 h treatment with 200 nM rapamycin. Data is presented as mean + s.d. n = 4 biologically independent experiments. Statistical significance was assessed using two‐way ANOVA t‐test.
Source data are available online for this figure.
