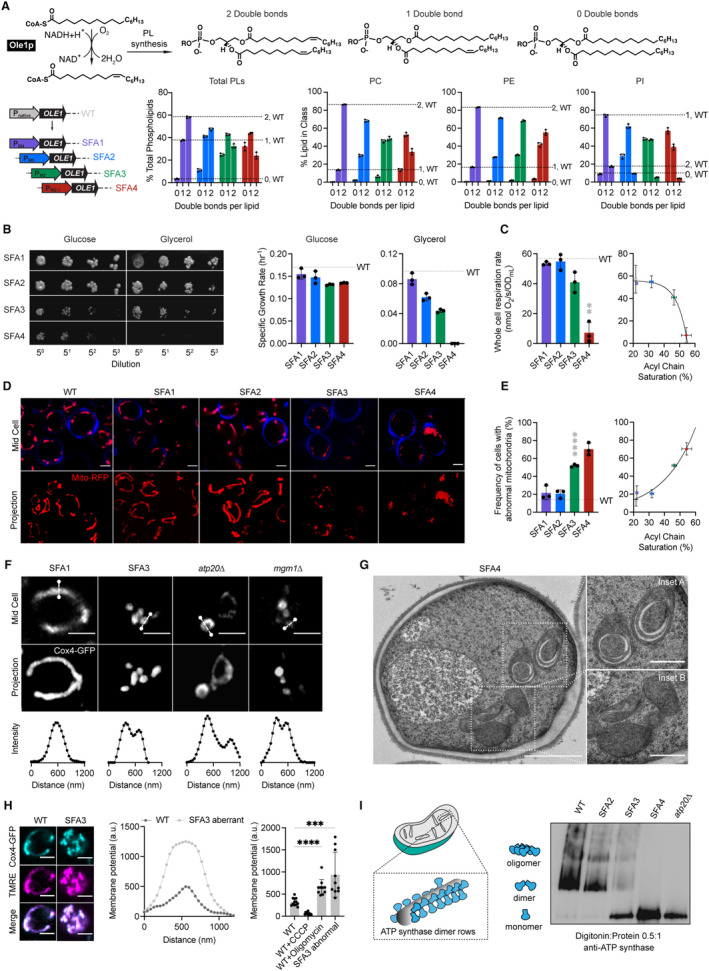
Figure 1. Modulation of OLE1 expression results in a critical level of PL saturation driving loss of ATP synthase oligomerization and mitochondrial morphology.

- The yeast desaturase, Ole1p, is an oxygen‐dependent enzyme that introduces cis double bonds at the C9 position (top left). SFA strains were generated via promoter substitution, resulting in progressively decreasing levels of OLE1 expression (bottom left). Lipidomics analysis showing double bond distributions of the total PL pool as well as of individual PLs within SFA strains; the wild‐type distribution is depicted with dotted lines. Error bars indicate SD from biological replicates n = 3.
- SFA4 cells lose viability under respiratory conditions. Shown are serial dilutions of yeast cells plated on media containing fermentable (glucose) and non‐fermentable (glycerol) carbon sources and specific growth rates for each in liquid cultures. Error bars indicate SD from n = 3 independent cultures.
- (Left) SFA3 and SFA4 cells show a drop in whole‐cell respiration, measured using a Clark electrode. Error bars indicate SD from n = 3 independent cultures. **P = 0.004, unpaired two‐tailed t‐test of SFA4 compared against wild‐type. (Right) Scatter plot depicting a fitted single exponential (R 2 = 0.99) for the decrease in respiration as a function of acyl chain saturation.
- SFA3 and SFA4 cells lose tubular mitochondrial morphology. Shown are representative Airyscan confocal micrographs of yeast expressing matrix‐localized RFP (mts‐RFP). Cells were stained with cell wall‐binding calcofluor white (blue) for clarity. Scale bars, 2 μm.
- Mitochondrial morphology changes between SFA2 and SFA3 strains, as assayed by confocal microscopy of cells harboring an mts‐RFP plasmid. N > 50 cells were counted in biological triplicate in each condition. Error bars indicate SD from n = 3 independent cultures. ****P < 0.0001, unpaired two‐tailed t‐test of SFA3 compared against wild‐type. (Right) Scatter plot depicting a fitted single exponential (R 2 = 0.97) for the increase in frequency of abnormal mitochondria as a function of acyl chain saturation.
- Airyscan confocal micrographs of yeast expressing IMM protein Cox4‐GFP showing hollow mitochondria in SFA3 cells, as is also observed in mutants of CM‐shaping proteins. Scale bars, 2 μm. Profiling analysis (below) depicts fluorescence intensity as a function of the distance across the indicated mitochondrion; two peaks indicate a lack of fenestrated IMM.
- Thin‐section TEM micrographs of high‐pressure frozen (HPF) SFA4 yeast showing the appearance of an onion‐like (Inset A) IMM and total loss of CM (Inset B). Scale bars, 1 μm (full image), 400 nm (insets A and B).
- Abnormal mitochondria show an increase in membrane potential, consistent with loss of ATP synthase, but not ETC activity. (Left) Representative micrographs are shown of individual cells expressing Cox4‐GFP and stained with TMRE. (Center) Example membrane potential line scan plots showing an example of an abnormal SFA3 cell with higher TMRE intensity compared to WT. (Right) Quantification of TMRE peak intensities from line profiling analysis of N > 10 cells per condition showing a higher membrane potential in aberrant mitochondria, as well as those where ATP synthase is inhibited by oligomycin (5 μM), and lower potential in cells treated with the uncoupler CCCP (20 μM). The line profile measured the intensity between two points crossing an individual mitochondrion. Scale bars, 2 μm. ***P < 0.0005, ****P < 0.0001 unpaired two‐tailed t‐test of SFA3 aberrant and WT + oligomycin compared against WT. Error bars indicate SD.
- ATP synthase oligomerization is lost with increasing PL saturation. SFA2 mitochondria lose higher order oligomers observed in WT cells, while SFA3 and SFA4 mitochondria possess predominantly monomeric ATP synthase, similar to atp20 cells. Shown are BN‐PAGE western blots of digitonin‐solubilized purified mitochondria, atp20 is the monomeric ATP synthase control.
Source data are available online for this figure.
