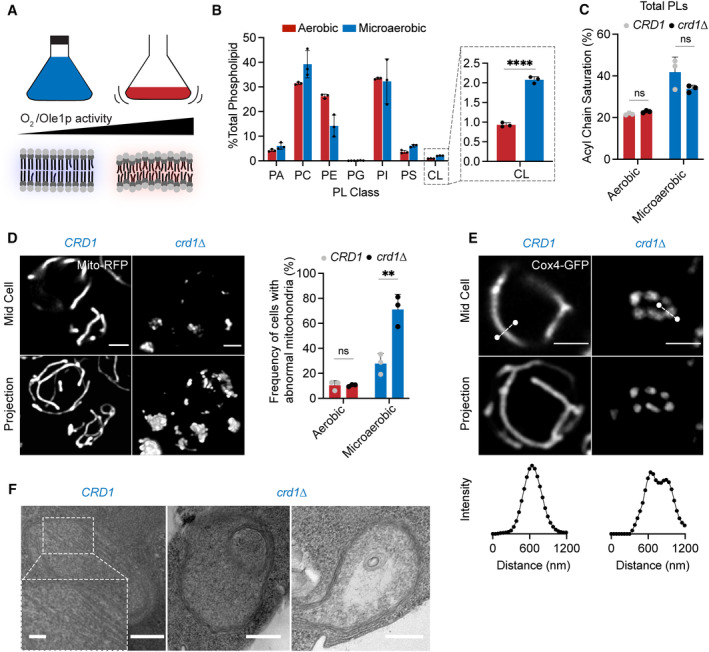
Figure 6. Cardiolipin synthesis is essential for mitochondria in yeast growth conditions characterized by low oxygenation.

- Schematic representation of different oxygen concentrations in different yeast growth environments. Microaerobic conditions cause increased saturation of membranes due to lower desaturate activity of Ole1p, an oxygen‐dependent enzyme.
- WT cells increase the abundance of CL under microaerobic conditions. Shown are abundances of each PL class, n = 3 biological replicates. Error bars indicate SD. ****P < 0.0001, unpaired two‐tailed t‐test compared against wild‐type.
- Microaerobic growth conditions cause an increase in acyl chain saturation in the total PL pool, which is not affected by loss of CL in crd1 strains as determined by an unpaired t‐test. Error bars indicate SD from n = 3 biological replicates.
- Under microaerobic conditions, loss of CL (crd1 ) causes loss of tubular mitochondrial structure. WT (CRD1) and crd1 cells were grown in microaerobic chambers for 48 h prior to imaging, n = 3 biological replicates. Scale bars, 2 μm. **P < 0.005, unpaired two‐tailed t‐test compared against WT.
- Microaerobic crd1 show hollow mitochondria, imaged with Cox4‐GFP. Scale bars, 2 μm. Line profile analysis (below) depicts fluorescent intensity across the indicated mitochondria.
- Under microaerobic conditions, CRD1 cells contain long, sheet‐like cristae structures while crd1 cells lack cristae, and display both onion‐like and flat abnormal IMM structures as visualized by thin‐section TEM. Scale bars, 250 nm. Inset showing abundant cristae sheets in CRD1 cells, scale bar, 125 nm.
Source data are available online for this figure.
