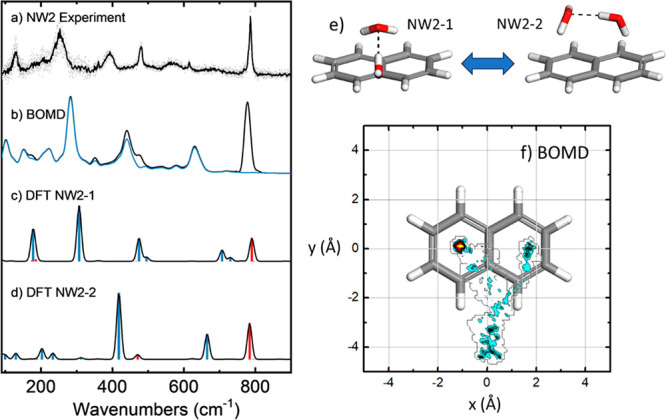
Figure 3.

(a) Far-IR gas phase ion-dip action spectra of jet-cooled naphthalene–water2 (NW2) complexes compared to the predictions of the (b) BOMD and (c,d) harmonic DFT (B3LYP) computations; computational frequencies are scaled with a factor of 0.98. The blue trace in the BOMD spectrum is obtained from the deconvolution of the water motions within the complex, whereas the corresponding harmonic modes in the DFT spectrum involving water are represented as blue bars (red bars denote pure naphthalene modes). (e) The two conformations of lowest energy of the NW2 complex at the B3LYP level, and (f) spatial distribution of the O atom of the water molecules projected on the naphthalene plane, as derived from the BOMD trajectory.
