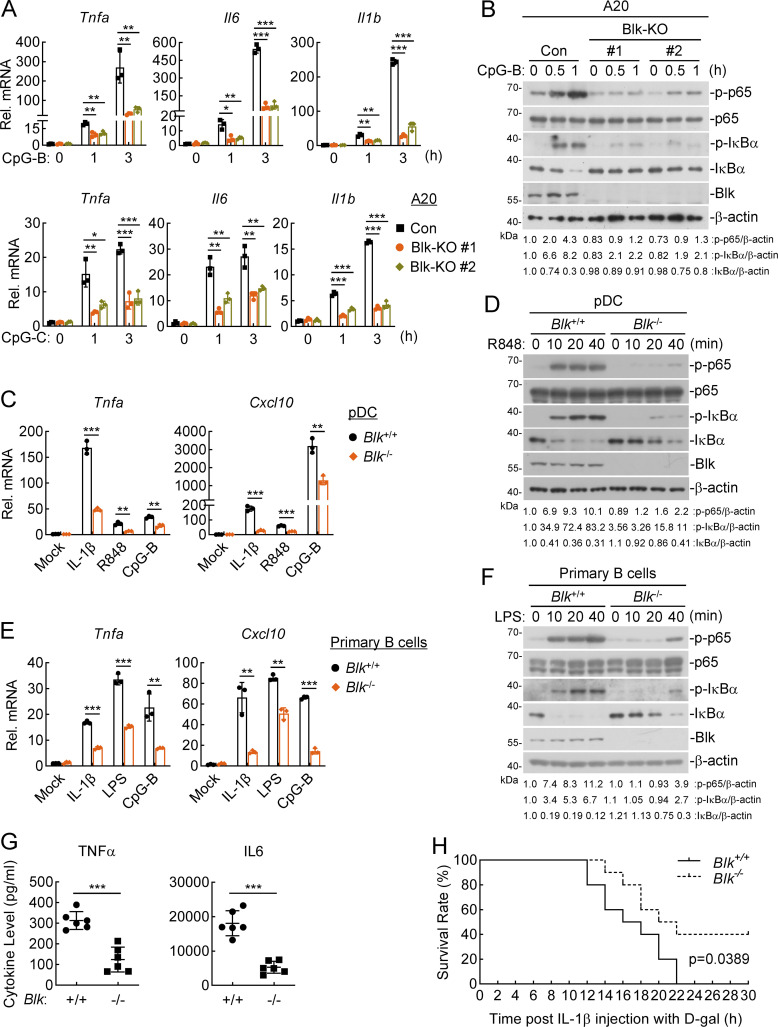
Figure 2.
Blk deficiency attenuates TLR/IL-1R–mediated inflammatory responses in vivo. (A and B) Effects of Blk deficiency on CpG-B/C–induced transcription of downstream genes and phosphorylation of p65 and IκBα. Murine A20 cells were transduced with control (Con) or the indicated gRNA plasmids targeting Blk gene by the CRISPR/Cas9 method to establish stable cell lines. Blk-deficient and control cells (2 × 10⁵) were left untreated or treated with CpG-B/C (1 μM) for the indicated times before qPCR (A) and immunoblot (B) analyses. KO, knockout. (C and D) Effects of Blk deficiency on IL-1β–, R848-, and CpG-B–induced transcription of downstream genes and phosphorylation of p65 and IκBα. pDCs derived from the spleens of Blk+/+ and Blk−/− mice (1 × 10⁵) were stimulated with murine IL-1β (20 ng/ml), R848 (10 μg/ml), or CpG-B (1 μM) for 3 h before qPCR analysis (C), or stimulated with R848 (10 μg/ml) for the indicated times before immunoblot analysis (D). (E and F) Effects of Blk deficiency on IL-1β–, LPS- and CpG-B–induced transcription of downstream genes and phosphorylation of p65 and IκBα. Primary B cells derived from the spleens of Blk+/+ and Blk−/− mice (5 × 10⁵) were seeded in 12-well plates for 48 h in the presence of anti-lgM/IgG (5 μg/ml) and anti-CD40 antibody (1 μg/ml). Cells were then stimulated with murine IL-1β (20 ng/ml), LPS (100 ng/ml), or CpG-B (1 μM) for 3 h before qPCR analysis (E), or stimulated with LPS (100 ng/ml) for the indicated times before immunoblot analysis (F). (G) Effects of Blk deficiency on IL-1β–induced serum cytokine levels. Sex- and age-matched Blk+/+ and Blk−/− mice (n = 6 for each group) were injected i.p. with murine IL-1β (150 μg/kg) for 2 h before serum cytokines were measured by ELISA. (H) Effects of Blk deficiency on IL-1β–induced inflammatory death. Sex- and age-matched Blk+/+ and Blk−/− mice (n = 10 for each group) were injected i.p. with murine IL-1β (150 μg/kg) plus D-gal (0.5 mg/g) per mouse, and mouse survival was recorded every 1 h. Graphs show mean ± SD (n = 3 technical replicates in A, C, and E, n = 6 biological replicates in G) from one representative experiment. *P < 0.05, **P < 0.01, ***P < 0.001 (unpaired, two-tailed Student’s t test). For the mouse survival study in H, Kaplan–Meier survival curves were generated and analyzed by the log-rank test. Data are representative of at least two independent experiments with similar results. Source data are available for this figure: SourceData F2.

