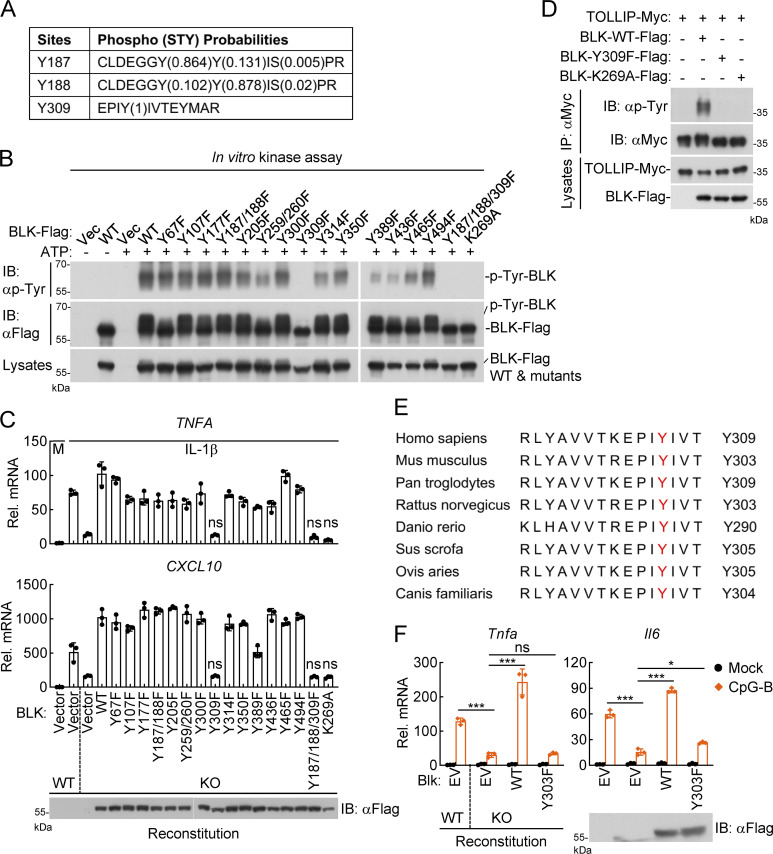
Figure 6.
Autophosphorylation of BLK at Y309 is critical for its regulation of TLR/IL-1R–mediated inflammatory signaling. (A) Identification of potential autophosphorylation sites of BLK by mass spectrometry. The in vitro phosphorylated BLK in Fig. 5 D was subjected to mass spectrometry. The list shows the phosphorylated peptide sequences and phosphorylation (STY) probabilities. (B) BLK catalyzes autophosphorylation mainly at Y309. Purified Flag-tagged BLK and its mutants coupled with Protein G sepharose were subjected to in vitro BLK autophosphorylation assays. (C) Effects of reconstitution of BLK-deficient cells with BLK and its mutants on IL-1β–induced transcription of downstream genes. BLK-deficient and control U87MG cells (2 × 10⁵) were transfected with the same amount of BLK or its mutants for 24 h. Cells were then left untreated or treated with IL-1β (20 ng/ml) for 3 h before qPCR analysis. The lower blot shows the expression levels of BLK and its mutants as detected by anti-Flag antibody. KO, knockout. (D) BLK(Y309F) fails to mediate tyrosine phosphorylation of TOLLIP. HEK293 cells (2 × 10⁶) were transfected with the indicated plasmids for 24 h. Coimmunoprecipitation (IP) and immunoblot (IB) analysis were performed with the indicated antibodies. (E) Sequence alignment of BLK from the indicated species. The sequences correspond to aa 298–312 of human BLK. The conserved tyrosine residues are highlighted in red. (F) Effects of reconstitution of Blk-deficient cells with Blk or its mutant on CpG-B–induced transcription of downstream genes. Blk-deficient A20 cells were transduced with Blk or Blk(Y303F) plasmids by lentivirus-mediated gene transfer to establish the stable cell lines with blasticidin S (10 μg/ml) selection. The indicated cell lines (2 × 10⁵) were then left untreated or treated with CpG-B (1 μM) for 3 h before qPCR analysis. The lower blot shows the expression levels of Blk and Blk(Y303F) in the indicated cell lines as detected by anti-Flag antibody. Graphs show mean ± SD (n = 3 technical replicates in C and F) from one representative experiment. *P < 0.05, ***P < 0.001, ns, not significant (unpaired, two-tailed Student’s t test). Data are representative of three independent experiments with similar results. Source data are available for this figure: SourceData F6.

