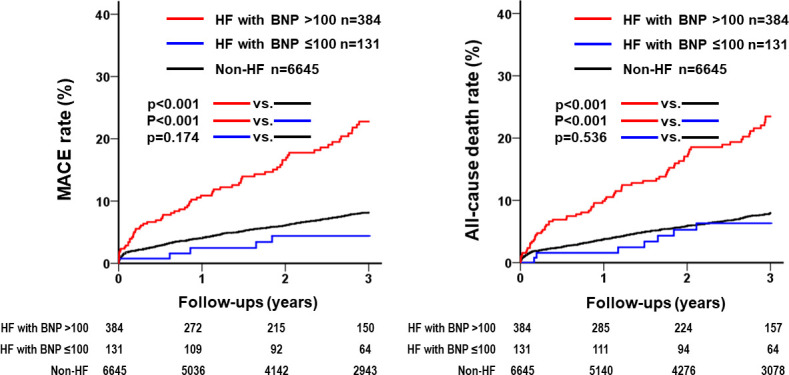
Figure 2.

Kaplan-Meier estimates of MACE and all-cause death. Kaplan-Meier curves show the rates of MACE and all-cause death after PCI according to HF and severity (BNP level). The MACE and all-cause rates were significantly higher in the HF with high BNP level group than in the other groups. BNP, brain natriuretic peptide; HF, heart failure; MACE, major adverse cardiac events; PCI, percutaneous coronary intervention.
