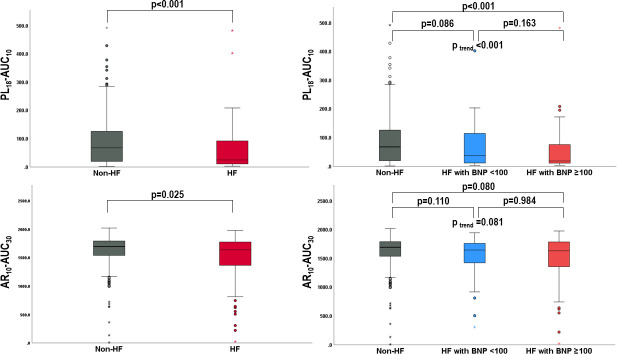
Figure 3.
Total Thrombus-Formation Analysis System level in patients with and without HF and patients with HF with high BNP levels, HF with low BNP levels and without HF. Upper box plot shows the level of PL-AUC in patients with and without HF and patients according to HF and severity (BNP level). Lower box plot shows the level of AR-AUC in patients with and without HF and patients according to HF and severity (BNP level). AR, atheroma chip; AUC, area under the curve; BNP, B-type natriuretic peptide; HF, heart failure; PL, platelet chip.

