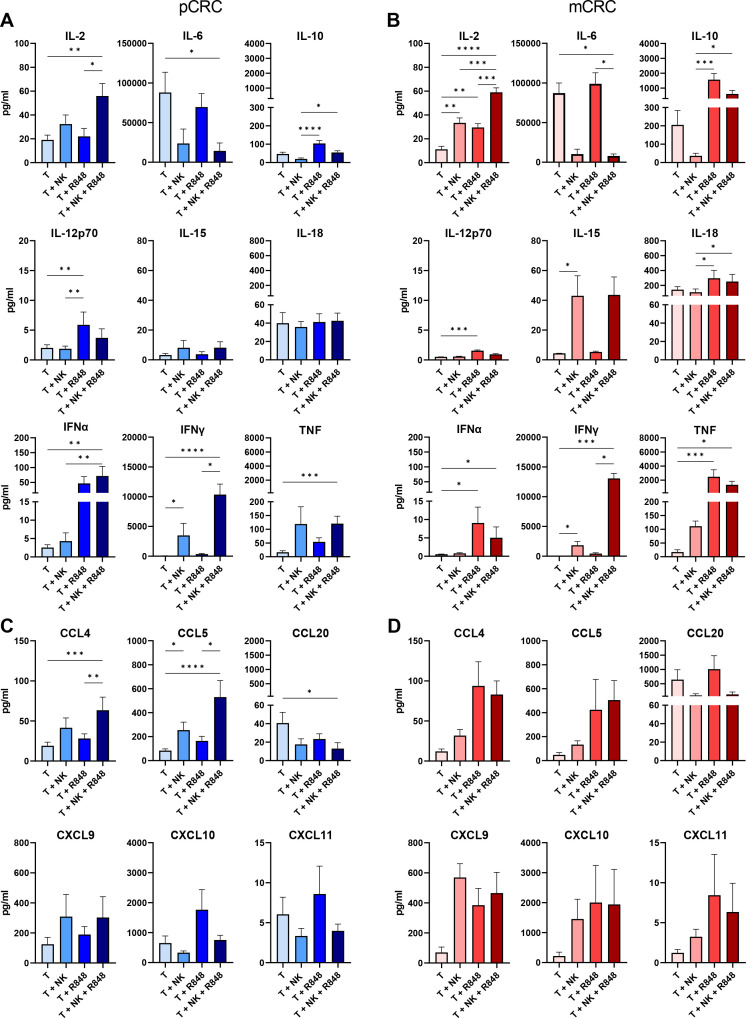
Figure 6.
Changes in the cytokine and chemokine profile on co-culture of pCRC-SCS or mCRC-SCS with or without NK cells and/or R848. Cytometry bead array performed on the supernatant of pCRC-SCS or mCRC-SCS cultured for 5 days in the presence and absence of NK cells and/or R848. NK cell:SCS ratio 1:1. Cytokine levels: (A) pCRC-SCS and (B) mCRC-SCS. Chemokine levels: (C) pCRC-SCS and (D) mCRC-SCS. pCRC: n=9; 3 NK donors (IL-6 n=5), mCRC: n=6: 3 NK donors. The data are presented as mean±SEM. Significance is presented as p<0.05*, <0.01**, 0.001***, 0.0001****. P values are determined by Friedman ANOVA with Dunn’s multiple comparison analysis or one-way ANOVA with Tukey multiple comparison analysis (pCRC and mCRC: IL-2, CCL4). ANOVA, analysis of variance; CCL, C-C Motif Chemokine Ligand; CRC, colorectal cancer; CXCL, X-C Motif Chemokine Ligand; IFN, interferon; IL, interleukin; mCRC, metastatic CRC, NK, natural killer; pCRC, primary CRC; SCS, single-cell suspensions; T, tumor.

