Figure 3.
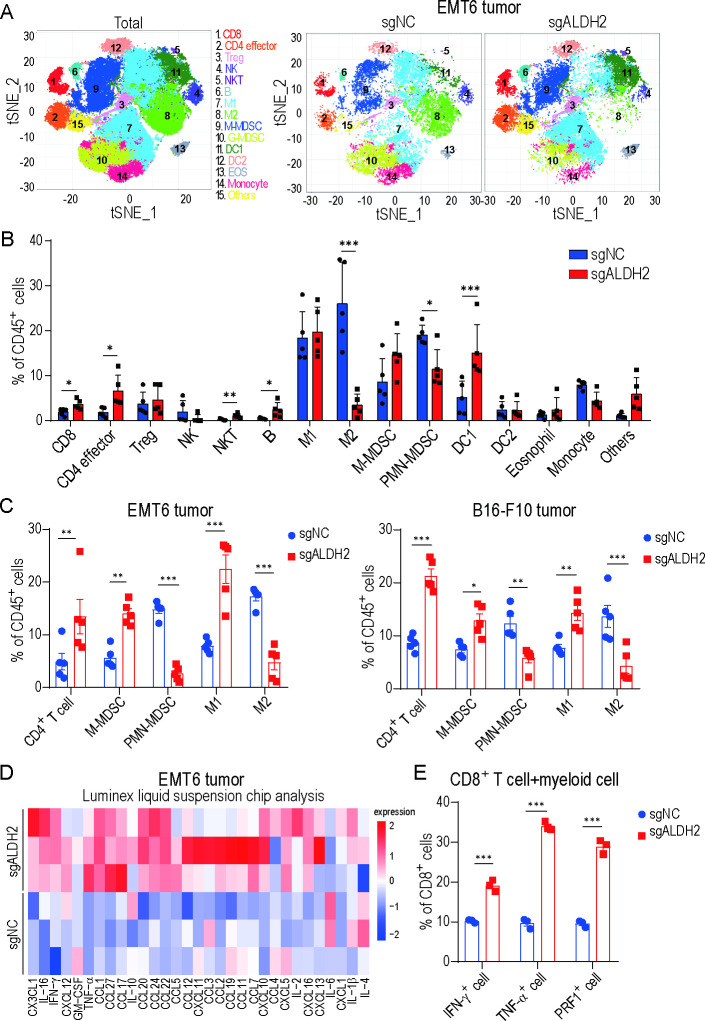
Inhibiting ALDH2 reshapes tumor immune landscape. (A) T-SNE plot of tumor-infiltrating leukocytes overlaid with color-coded clusters from ALDH2-knockout and control EMT6 tumors. (B) Frequency of clusters in indicated immune cell subsets from ALDH2 knockout and control tumors (n=5, t-test). (C) Representative quantification of CD4+ T cell, M-MDSC, PMN-MDSC, M1-like macrophage and M2-like macrophage of CD45+ live cells in EMT6 (left) and B16-F10 (right) tumors (n=5, two-way ANOVA). (D) Heatmap showing the average relative secretion of cytokines/chemokines enriched in ALDH2 knockout tumors compared with controls (n=3/group). (E) Representative quantification of IFN-γ+ cell, TNF-α+ cell and PRF1+ cell of CD8+ T cell co-cultured with myeloid cell isolated from ALDH2 knockout or control tumors (n=3, two-way ANOVA). Mean±SEM; *p<0.05; **p<0.01; ***p<0.001. GM-CSF, granulocyte-macrophage colony-stimulating factor; Tregs, regulatory T cells; t-SNE, t-distributed Stochastic Neighbor Embedding.

