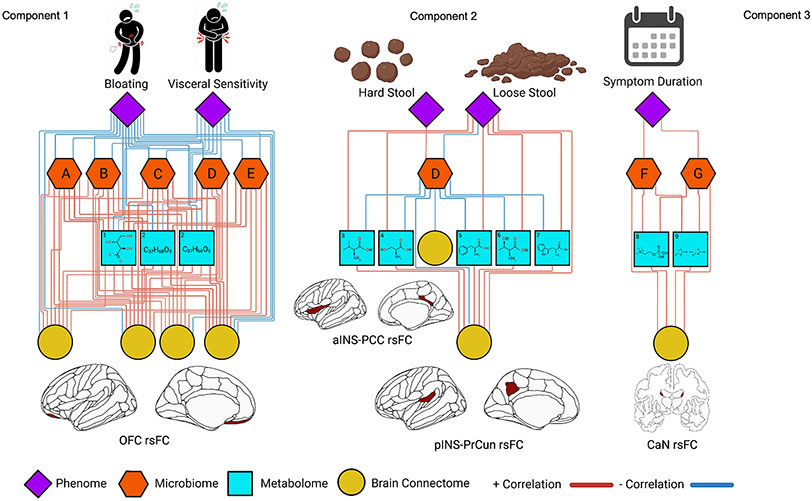
Fig. 2.
Relevance network from the DIABLO analysis depicting the correlation between different ’omics types. Red lines represent positive correlations and blue lines represent negative correlations. Cutoff for the correlations was r = 0.7. Microbiome features include (A) Paraprevotella. sp, (B) Blautia obeum, (C) Streptococcus. sp, (D) Prevotella 9. sp, (E) Catenibacterium mitsuokai (F) Faecalibacterium prausnitzii and (G) Bacteroides stercoris. Metabolome features include (1) erythronate, (2) palmitoyl-linoleoyl-glycerol, (3) valine, (4) serine, (5) phenylalanine, (6) threonine, (7) tryptophan, (8) phosphocholine, and (9) creatinine. Brain connectome features include (1) orbitofrontal cortex (CAN) resting-state functional connectivity (rsFC), (2) rsFC between the anterior insula (SAL) and posterior cingulate (DMN). rsFC between the posterior insula (SMN) and subparietal sulcus (DMN). (3) rsFC between the caudate nuclei (SMN).

