
Figure 1.
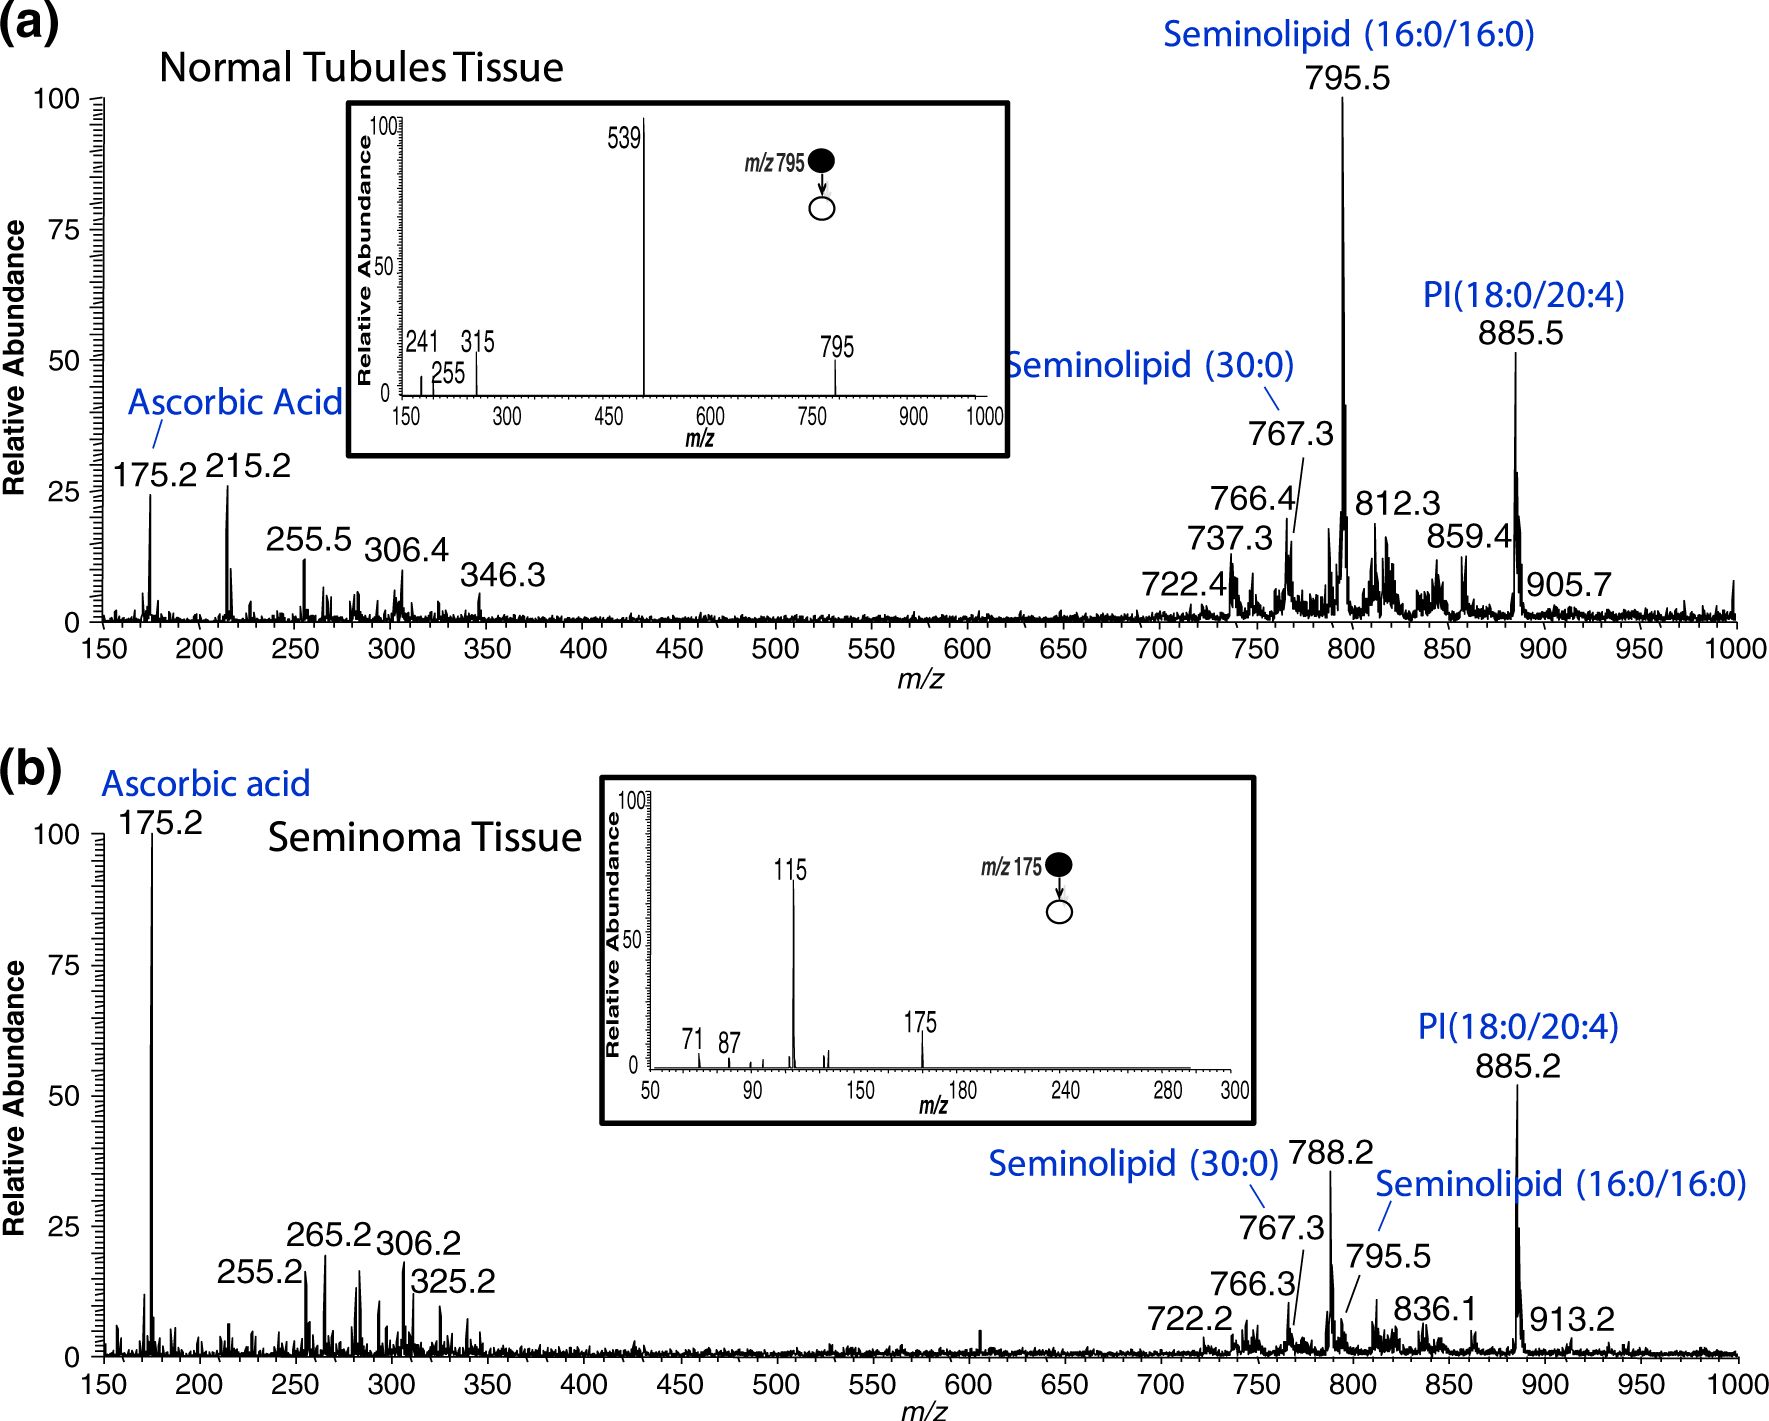
Representative negative ion mode full scan mass spectra of seminoma and adjacent normal tissues in the range of m/z 150 to m/z 1000. (a) Negative ion mode mass spectrum of the seminoma region of tissue sample UH0001–02. Inset is the MS/MS spectrum for the seminolipid (16:0/16:0), precursor ion m/z 795.4. (b) Negative ion mode mass spectrum of the normal region of the tissue sample UH0001–02. Inset is the MS/MS product ion spectrum for ascorbic acid, precursor ion m/z 175.2