
Figure 2.
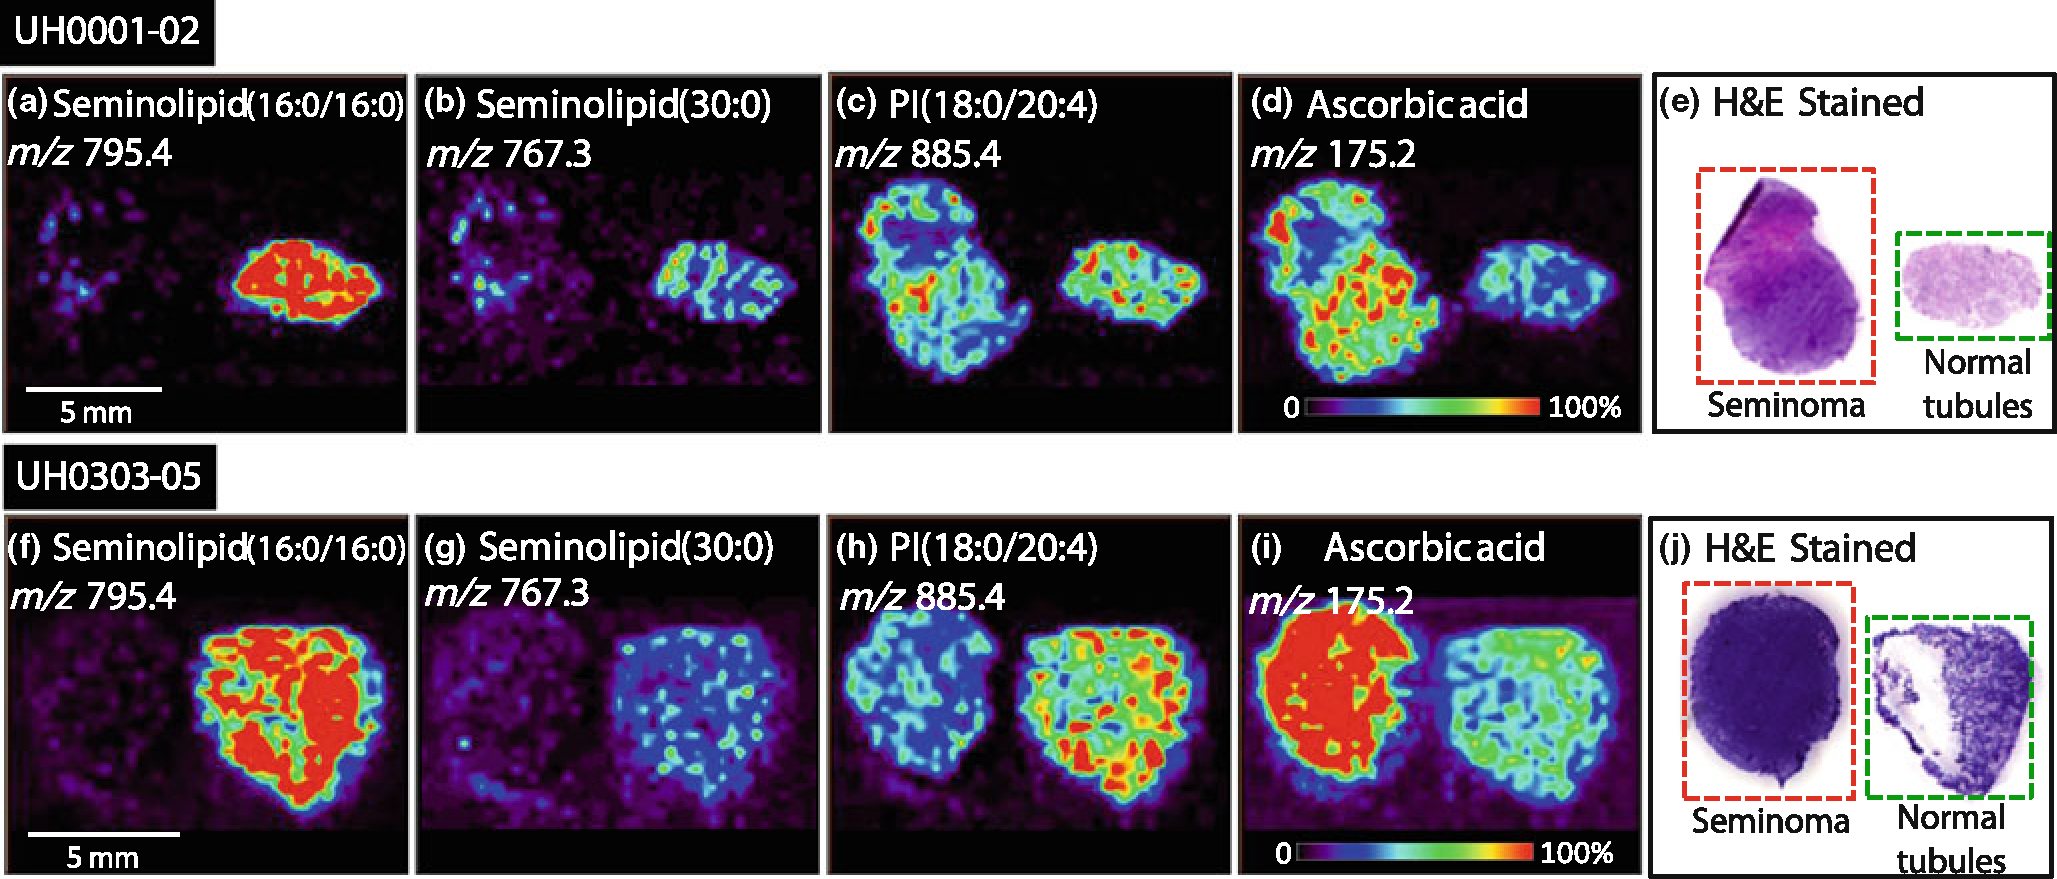
Negative ion mode tissue imaging of seminoma and adjacent normal tissue; (a) UH0001–02 ion image of m/z 795.4, seminolipid (16:0/16:0,) (b) UH0001–02 ion image of m/z 767.3, seminolipid (30:0), (c) UH0001–02 ion image of m/z 885.4, PI (18:0/20:4), (d) UH0001–02 ion image of m/z 175.2, ascorbic acid, (e) UH0001–02 H&E stained tissue sections of seminoma and normal tissue, (f) UH0303–05 ion image of m/z 795.4, seminolipid (16:0/16:0), (g) UH0303–05 ion image of m/z 767.3, seminolipid (30:0), (h) UH0303–05 ion image of m/z 885.4, PI(18:0/20:4), (i) UH0303–05 ion image of m/z 175.2, ascorbic acid, (j) UH0303–05 H&E stained tissue sections of seminoma and normal tissue