
Figure 3.
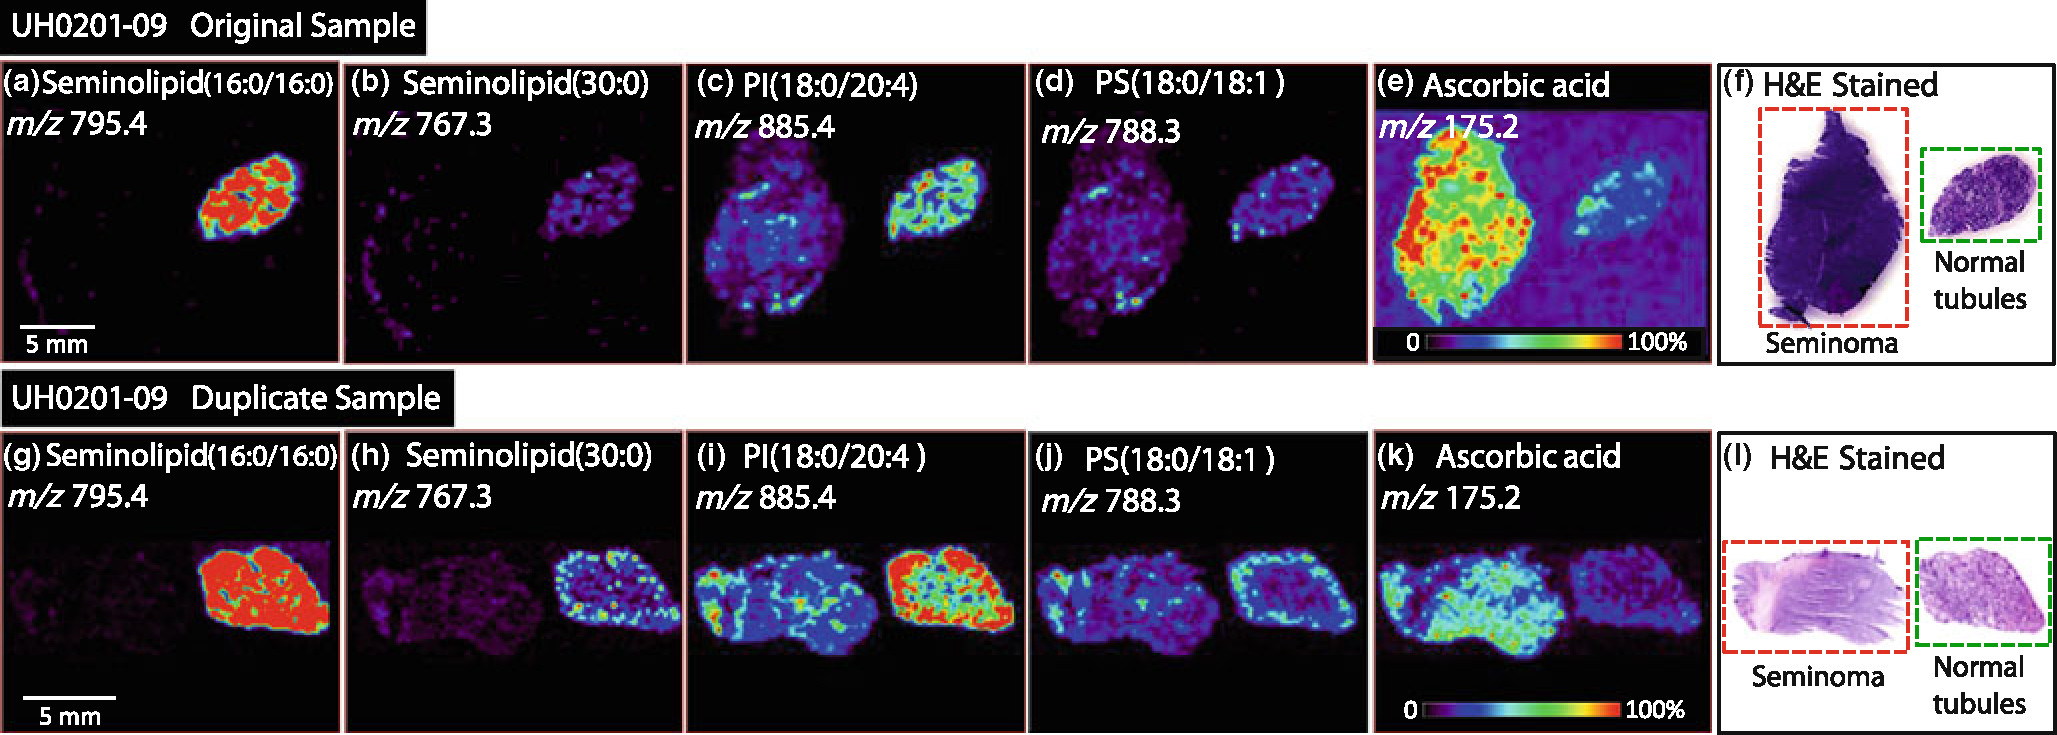
Negative ion mode tissue imaging of seminoma and adjacent normal tissue of duplicate tissue samples; (a)–(f) original tissue sections of UH0201–49, (a) ion image of m/z 795.4, seminolipid (16:0/16:0), (b) ion image of m/z 767.3, seminolipid (30:0), (c) ion image of m/z 885.4, PI(18:0/20:4), (d) ion image of m/z 788.3 (PS[18:0/18:1]), (e) ion image of m/z 175.2, ascorbic acid, (f) H&E stained tissue sections of seminoma and normal tissue. (g)–(I) Duplicate tissue sections of UH0201–49, (g) ion image of m/z 795.4, seminolipid (16:0/16:0), (j) ion image of m/z 767.3, seminolipid (30:0), (i) ion image of m/z 885.4, PI(18:0/20:4), (j) ion image of m/z 788.3 (PS[18:0/18:1]), (k) ion image of m/z 175.2, ascorbic acid, (l) H&E stained tissue sections of seminoma and normal tissue