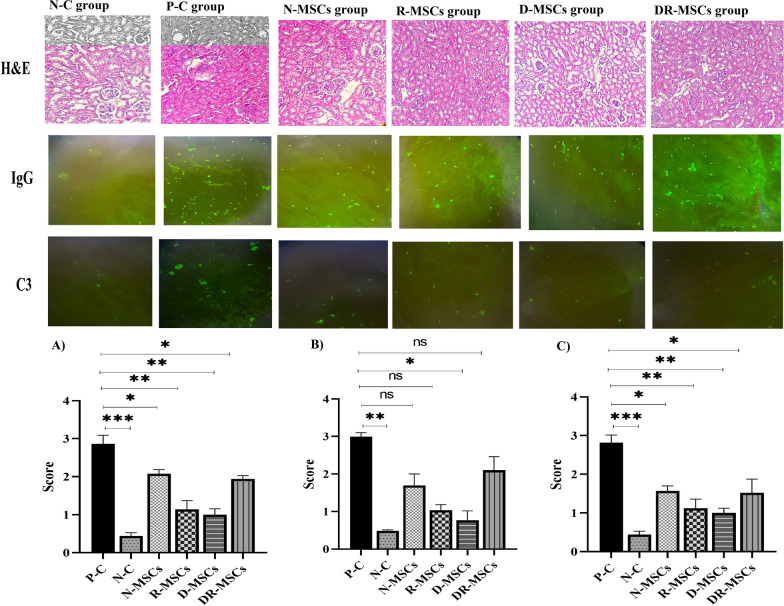
Fig. 4.
The comparative analysis of therapeutic effects of engrafted naïve MSCs or probiotic-educated MSCs on kidney microstructure. A. Hematoxylin and eosin-stained kidney sections of different groups at magnification × 100. Examination of H&E sections of the normal mice (N–C group) showed normal kidney architecture. In naïve MSCs, injection appeared to have a relatively normal structure in some areas, compared with the P–C group. Probiotic-trained-MSCs transplantation improved renal microstructure in the PIL mice model, including reduced basal membrane disorder, mesangial cell overgrowth in glomerular, and infiltration of cells. B and C). By the results of the light microscopic study, immunofluorescence analysis was performed on kidney sections obtained from mice in all experimental groups to evaluate the fluorescence intensity of immune complexes containing IgG (middle panels) or C3 (lower panels) associated with the immune response and inflammation. We found that PIL mice presented a significant increase in fluorescence intensity compared to normal mice. A remarkable reduction in the fluorescence intensity was seen in all MSCs treatments (either naïve MSCs or probiotic-pretreated MSCs) compared to the PIL mice treated with PBS. The administration of MSCs remarkably alleviated inflammation induced by Pristane compared with the PBS-treated mice; a highly significant difference in the parameters was detected in the D-MSCs group compared to other groups. Bonferroni’s multiple comparisons were used to determine the relationship between the variable’s means. N–C: Negative Control (Healthy mice treated with PBS); P–C: Positive Control (Pristane-immunized mice treated with PBS); N-MSCs (Naïve MSCs without any interventions); R-MSCs: MSCs exposed to lactobacillus rhamnosus; D-MSCs: MSCs exposed to lactobacillus delbrueckii; DR-MSCs: MSCs exposed to a mixture of lactobacillus rhamnosus and delbrueckii. Data were presented as Mean ± Standard Error of the Mean (SEM). P values of ≤ 0.05 were considered significant. (*P ≤ 0.05, **P ≤ 0.01, ***P ≤ 0.001)

