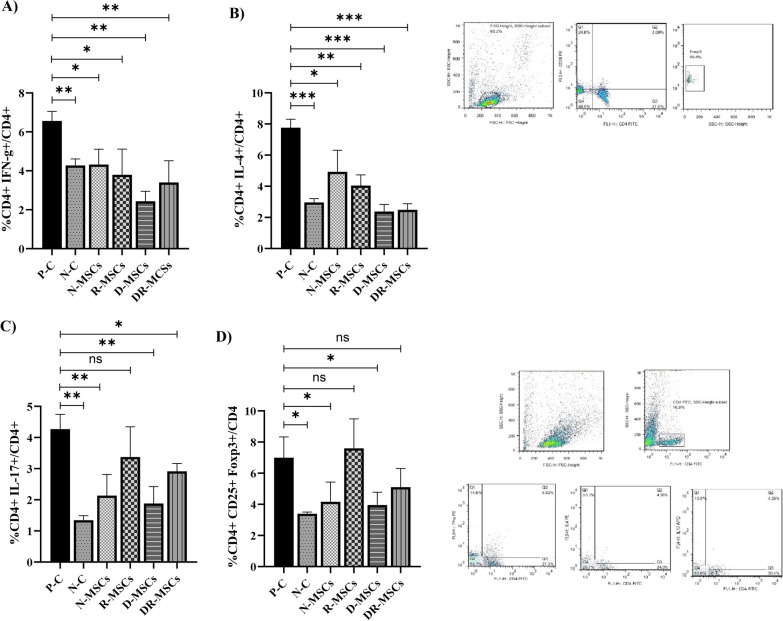
Fig. 6.
Flow cytometric analysis to evaluate the effect of engrafted MSCs on the frequency of splenocytes. A representative gating scheme and representative dot plots are also presented. Th1, Th2, Th17, and Treg percentages were significantly higher in the P–C group than in the N–C group. The population of Th1 and Th2 in all MSCs treated groups was significantly lower than in the P–C group (A and B). Transplantation of naïve MSCs and pre-exposure MSCs to L. delbrueckii significantly decreased the percentage of Treg and Th17 cells compared with the P–C group. However, there was no significant difference between the percentage of Th17 and Treg cells of mice treated with pre-exposure MSCs to L. rhamnosus with those of the P–C group. Furthermore, the percentage of Th17 cells in the DR-MSCs group was significantly reduced. However, no significant differences were observed regarding the percentage of Treg cells between the DR-MSCs and P–C groups. These findings support the hypothesis that bacteria can interact with MSCs and educate MSCs with potent immunosuppressive and immunomodulatory properties. Interestingly, a mix of bacteria did not have a similar effect as R-MSCs or D-MSCs. Tukey’s multiple comparisons were used to determine the relationship between the variable’s means. N–C: Negative Control (Healthy mice treated with PBS); P–C: Positive Control (Pristane-immunized mice treated with PBS); N-MSCs (Naïve MSCs without any interventions); R-MSCs: MSCs exposed to lactobacillus rhamnosus; D-MSCs: MSCs exposed to lactobacillus delbrueckii; DR-MSCs: MSCs exposed to a mixture of lactobacillus rhamnosus and delbrueckii. Data were presented as Mean ± Standard Error of the Mean (SEM). P values of ≤ 0.05 were considered significant. (*P ≤ 0.05, **P ≤ 0.01, ***P ≤ 0.001)

