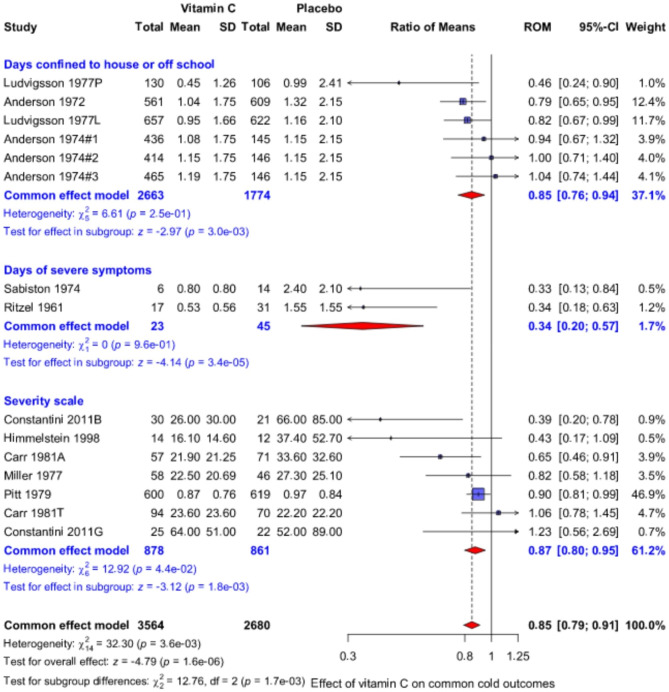
Fig. 2.
Effect of vitamin C on the severity of the common cold. The upper subgroup shows the effect on outcomes which are proxies for severe colds, the middle subgroup shows the effect on the duration of severe symptoms, and the lower subgroup shows the effect on severity scales. The horizontal lines indicate the 95% CI for the vitamin C effect and the blue squares in the middle of the horizontal lines indicate the point estimate of the effect in the particular trial. The size of the blue square reflects the weight of the trial in the meta-analysis. The red diamond shapes indicate the pooled effect and 95% CI for the three subgroups and for all 15 comparisons. See Additional files 1 and 2 for the description of the trials and the calculations. RoM, ratio of means; e.g. RoM = 0.8 corresponds to a 20% decrease in the outcome

